
The market bought itself a chance to sidestep a meltdown last week, though it's still within sight – and reach – of the cliff. One or two more bad days could still push key indices over a technical edge and kick off a painful pullback that we've been lucky to avoid thus far.
There's a slight chance stocks could blast through a ceiling and muster a bullish May, but that's certainly a tougher road to navigate as it sands right now.
The good news is, the make-or-break levels are pretty easy to spot here. We'll take a closer look at both sides of the coin after a review and preview of the more pressing economic numbers we got last week and will hear this week.
Economic Data
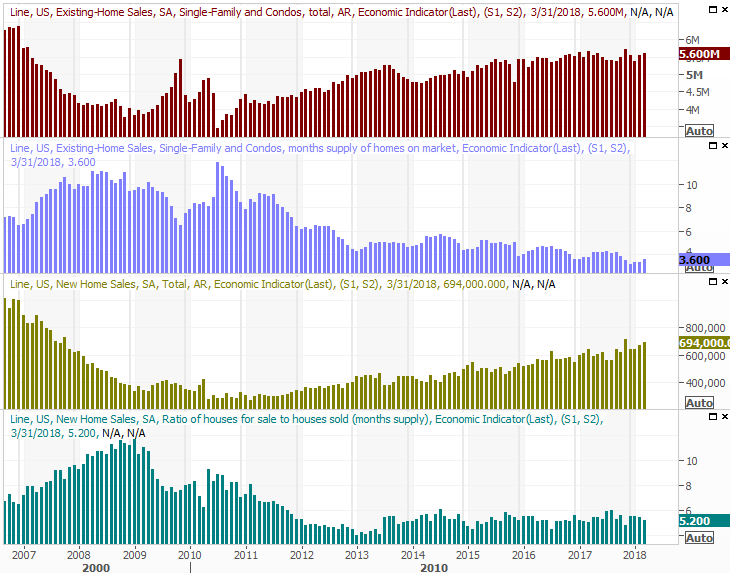
Pretty busy week last week. Let's just start at the beginning, with a look at last month's home sales data. Existing home sales were up, by more than expected, as were new homes sales…. by a lot, for the latter. Most noteworthy is that sales are accelerating again despite a distinct lack of inventory. That's great news for homebuilders, but also encouraging in the sense that – for the time being anyway – buyers aren't being stymied by higher interest rates.
New and Existing Home Sales Charts
 [1]
[1]
Source: Thomson Reuters
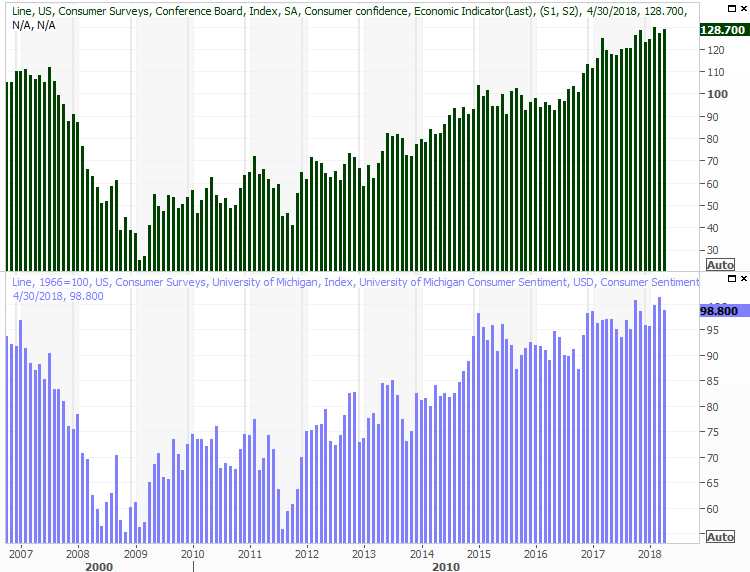
In that vein, consumer sentiment edged a little higher last month too, with the Conference Board's consumer confidence score. The Michigan Sentiment Index score pulled back a little, but both measures remain in long-term uptrends. This persistent optimism is largely what's, so far, prevented a market correction from taking full shape.
Consumer Sentiment Charts
 [2]
[2]
Source: Thomson Reuters
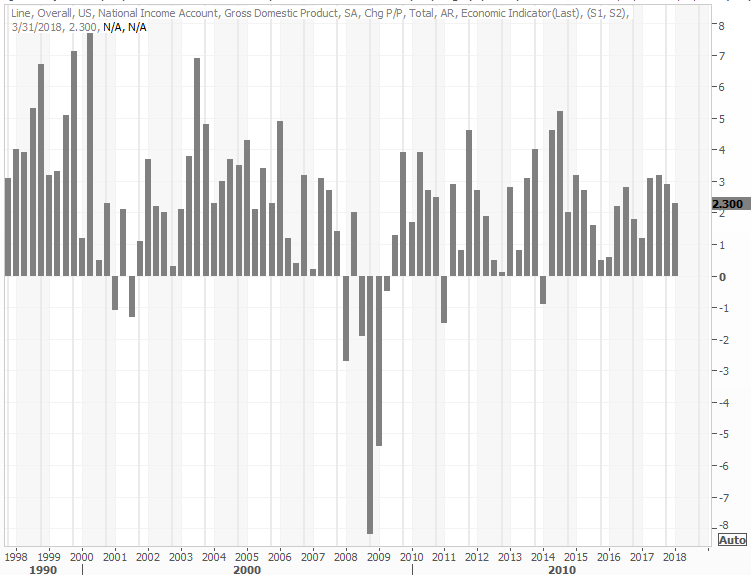
Finally, though it contracted from Q4's pace, the first quarter's GDP growth rate looks like it was stronger than expected. The first of three readings on Q1's GDP growth says it was up 2.3% versus expectations of only 2.1%.
GDP Growth Rate Charts
 [3]
[3]
Source: Thomson Reuters
While we'd certainly like GDP growth to be higher to support corporate earnings growth, GDP growth has been consistently higher for the past four quarters. There's a lot to be said for the cumulative benefit of broad economic growth (as it allows companies and consumers to be confident enough to make bigger investments).
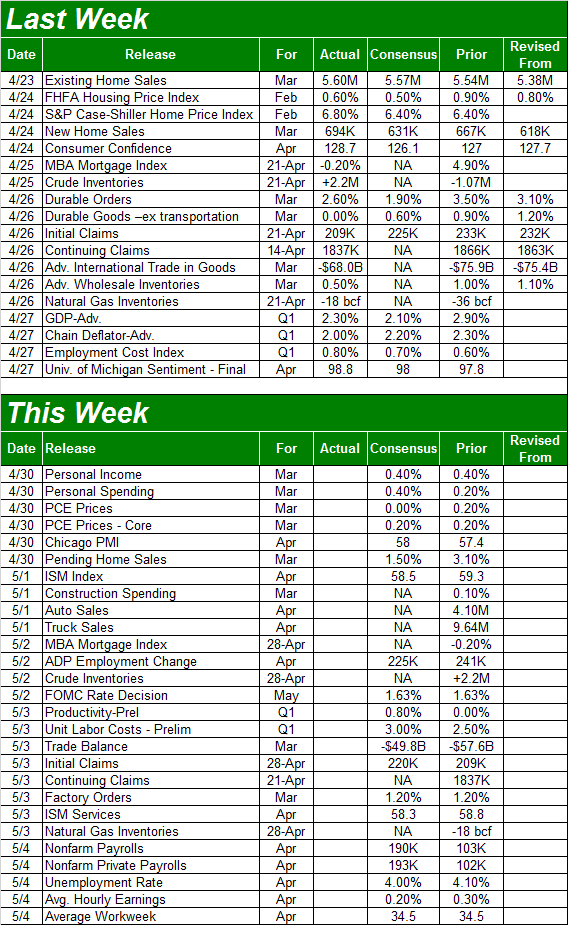
Everything else is on the grid.
Economic Calendar
 [4]
[4]
Source: Briefing.com
This week is going to be a busy one, though not quite as loaded as the table above would suggest. Not very many of the reports are terribly important. There are two important ones though… last month's employment report as well as Wednesday's interest rate decision.
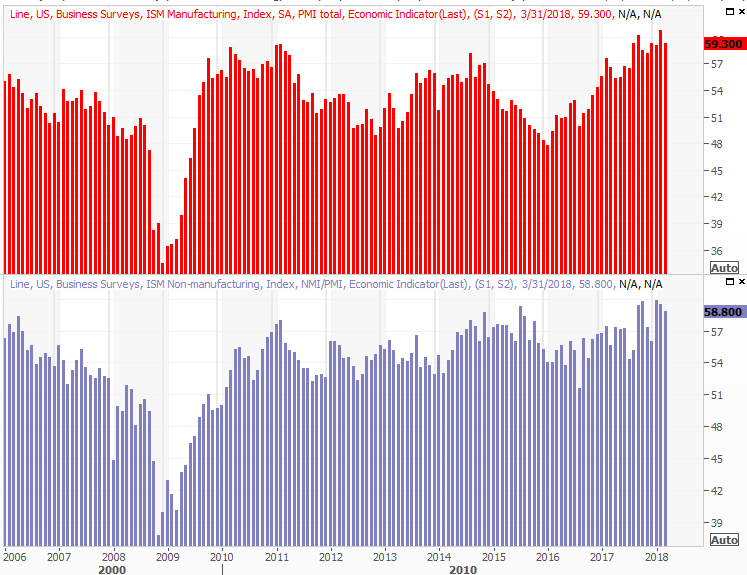
First and foremost though, the party starts in earnest on Tuesday with last month's ISM manufacturing index followed by the ISM services index report on Thursday. The pros think both edged a little lower, though both are also still in uptrends as well as above the critical 50 level. Also bear in mind that most guesses have underestimated how strong last quarter was.
ISM Index Charts
 [5]
[5]
Source: Thomson Reuters
No preview chart is necessary for it, but do buckle up on Wednesday. Whether or not the Federal Reserve chooses to scoot interest rates up a quarter point at the time, the market is going to dissect the daylights out of whatever scraps of perspective the FOMC is willing to dish out.
As of the most recent look, the odds say there's a only about a 7% chance of a rate increase this week, but traders are betting on a 93% chance interest rates to move up next month.
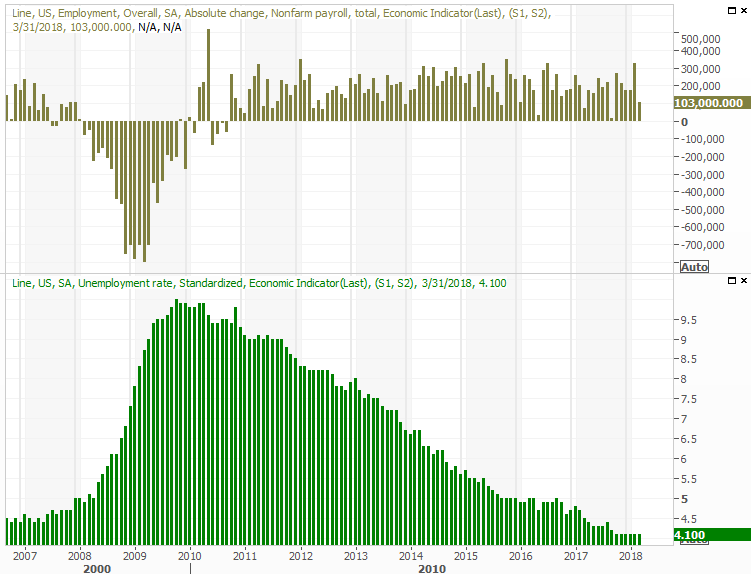
Finally, look for fireworks on Friday when we hear about April's jobs picture. The pros are looking for 190,000 new payrolls, which should be just enough to push the unemployment rate a tenth of a point lower.
Unemployment Rate and Payroll Growth Charts
 [6]
[6]
Source: Thomson Reuters
As we've mentioned before, with the economy at full employment, we're not apt to see a lot of progress in terms of people getting jobs – they've already got them. The litmus test going forward will be wage growth. Economists are calling for hourly earnings growth of 0.2%, though note that by other measures, employment costs during the first quarter grew the most they had since the last quarter of 2010.
We'll have our usual in-depth look at the jobs report posted at the website later that day.
Index Analysis
Impressed, or at least encouraged, by the bounce we saw late last week? Don't be. The bulls were perfectly positioned for a pushback, but the rebound effort we saw didn't clearly any of the most important hurdles. And, the volume behind the bounce late last week was anything but impressive.
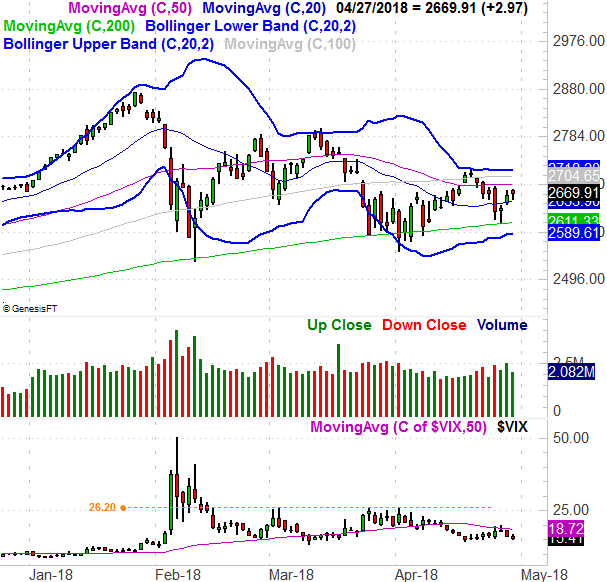
A close inspection of the daily S&P 500 chart tells the tale. Right on cure, the 200-day moving average line (green) turned into the technical floor we expected it to. But, the index is still below a couple of other key moving averages, and still below its upper 20-day Bollinger band. It doesn't take a very long look to recognize these lines have been technical ceilings in the recent past.
S&P 500 Daily Chart, with VIX and Volume
 [7]
[7]
Source: TradeNavigator
One noteworthy curiosity… the VIX. It does indeed appear to be trending lower now, which is more bullish than not.
It could be the case right now that the lull in the VIX really is an indication that volatility in the near term will be subdued; the 'sell in May' cliche exists for a reason. Or (and this is more likely), the falling VIX indicates a combination waning volatility and broad bullishness.
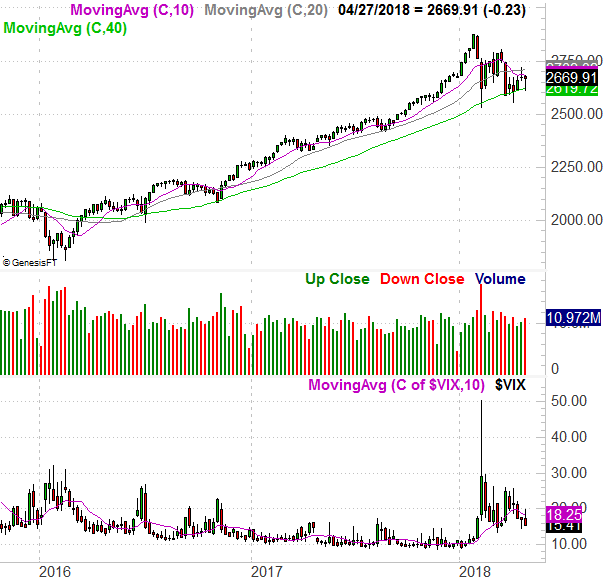
Zoom out to a weekly chart of the S&P 500 for some perspective. In this timeframe we can plainly see a string of lower highs and an index that continually puts pressure on the pivotal 200-day moving average line… a line that's not been broken below since 2016.
S&P 500 Weekly Chart, with VIX and Volume
 [8]
[8]
Source: TradeNavigator
It's a two-sided matter to process. On the one hand the persistent resilience is clear. On the other hand, it's clear we're overdue for a garden variety correction. To that end…
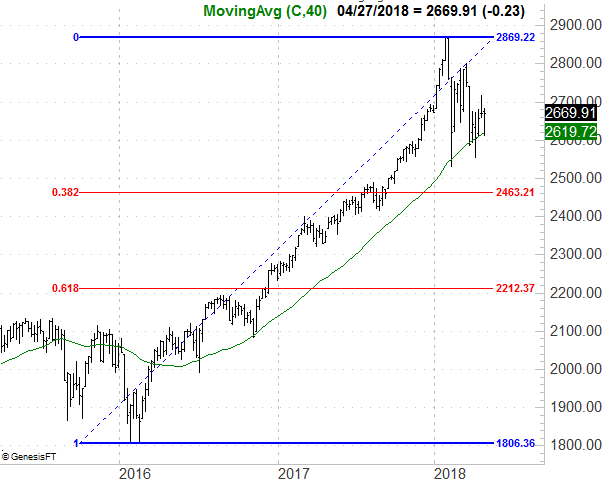
While we don't yet want to presume a more meaningful correction is inevitable, we do want to be prepared for it if and when it happens. So, should the 200-day line end up failing as a floor, the most plausible downside target from there is the 2460 area, which is a 38.2% Fibonacci retracement from the span between the big early 2016 low to the January high. This is the most 'natural' area at which the bulls and the bears will agree that 'enough is enough.'
S&P 500 Weekly Chart, with Fibonacci Lines
 [9]
[9]
Source: TradeNavigator
Again, we're not yet saying it's going to happen. The market may well punch through all of its technical ceilings immediately above. If so, that may well incite a wave of buying.
We're nowhere near that kind of event though, just as we're not yet the bigger-picture breakdown taking hold. This is a time to wait on the fence rather than force a trade.
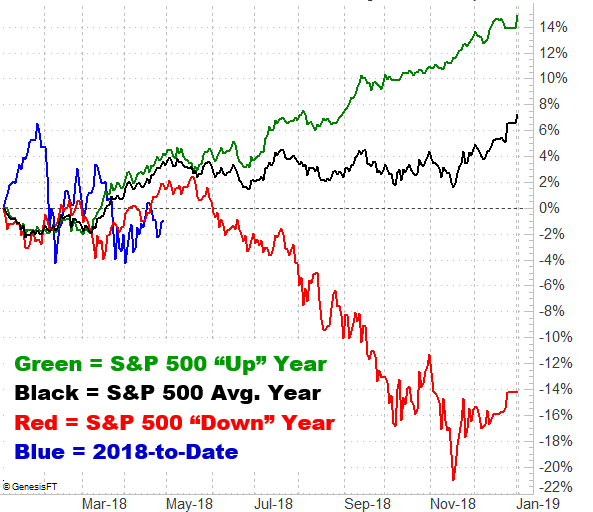
That being said, as a reminder, 'sell in May' isn't a completely silly premise, but it's one with a huge footnote. That is, in a bull market, you can skip May and June, but you don't want to be out of stocks by the beginning of July. Conversely, in a bear market, May, June, July, August and September are all stunningly miserable.
S&P 500 Annual Day-to-Day Performance Chart
 [10]
[10]
Source: TradeNavigator
The good news is, we're usually not in a bear market. The bad news is, though we're not in a 'bear market' right now, we're certainly starting off the year on a path that looks more like a "down" year than not.
Stay tuned.