
The second losing week in a row isn’t necessarily disastrous. But, last week’s setback did a bit more serious technical damage. Namely, both of the key indices are on the wrong side of a few-too-many lines in the sand, and within striking distance of some more important technical floors. The worst part of all? This deterioration seems a bit methodical, meaning traders appears to be adhering a pre-determined script that ends with the market finally trying to dish out an ordinary but overdue correction.
We’ll look at these support levels below, as always. First though (and also as always), let’s look at last week’s big economic news and preview what’s coming this week… a week with one very big item on the schedule that could really move the market.
Economic Data Analysis
There was only one economic report of any interest last week. That was Friday’s report of new home sales, from the Census Bureau. And, though still far from the kind of activity we were seeing prior to the COVID-19 pandemic, the better-than-expected figure of 628,000 improved on May’s upward-revised pace of 618,000. Still, this is hardly the beginning of a recovery. (Keep reading.)
Home Sales Charts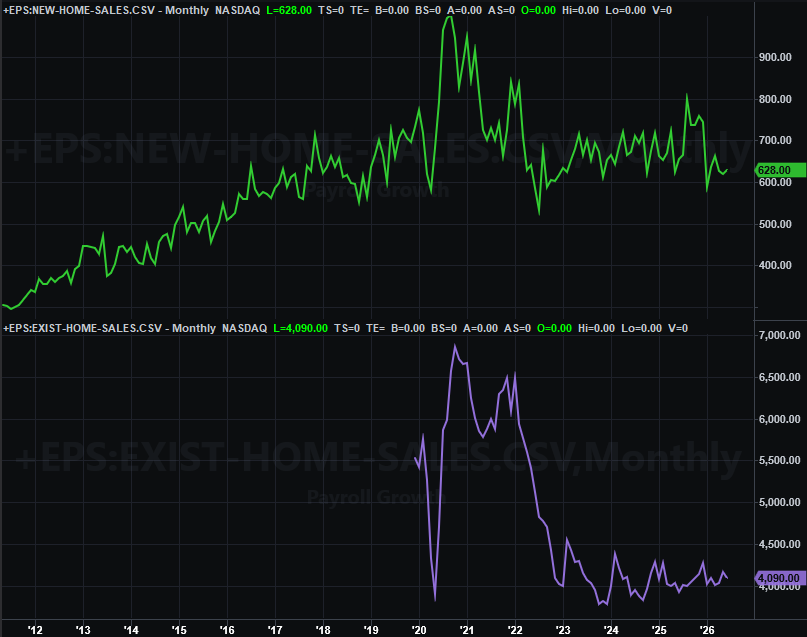
Source: National Association of Realtors, Census Bureau, TradeStation
Everything else is on the grid.
Economic Data Report Calendar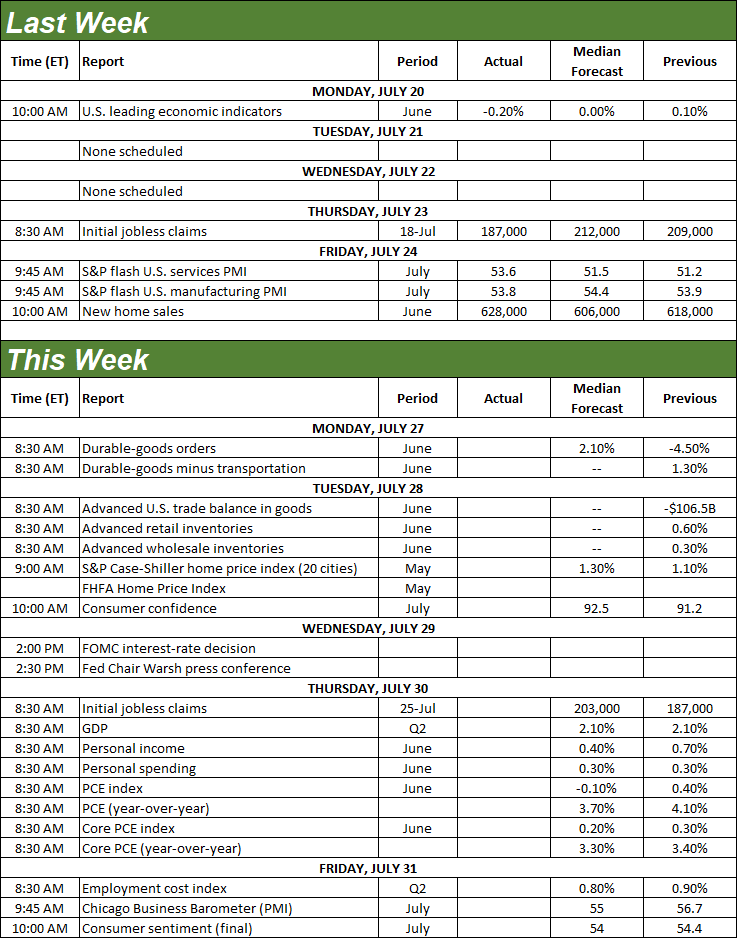
Source: Briefing.com, TradeStation
This week’s big news will of course be Wednesday’s decision on interest rates. As it stands right now, the market is saying there’s a 62% chance the Federal Reserve will leave the Fed Funds Rate at its current target range of 3.50% to 3.75%, with a 38% chance of a quarter-point hike.
That’s not the only news we’ll be getting this week, of course. The party starts in earnest on Tuesday, when we’re scheduled to get home prices report for May from the FHFA as well as Standard & Poor’s. Note that prices have been fading just a bit of late, and are likely to continue doing so at a shallow pace; home prices are finally jibing with purchase activity.
Home Price Index Charts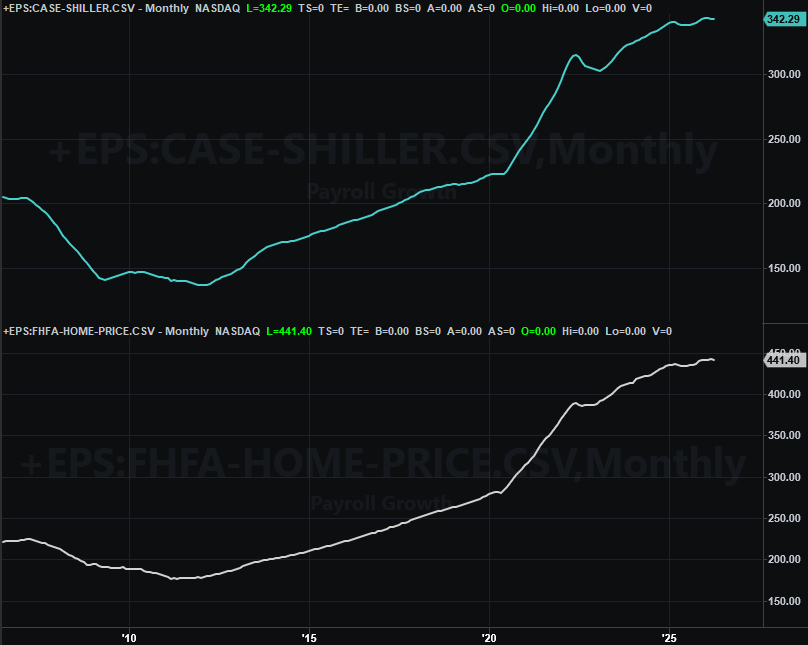
Source: Standard & Poor’s, FHFA, TradeStation
Also on Tuesday we’ll get July’s consumer confidence score from the Conference Board, to be followed on Friday by the third and final look at the University of Michigan’s consumer sentiment reading. Economists are looking for a slight improvement from June’s levels (with both data sets). Consumer optimism will still be quite low then, however.
Consumer Sentiment Charts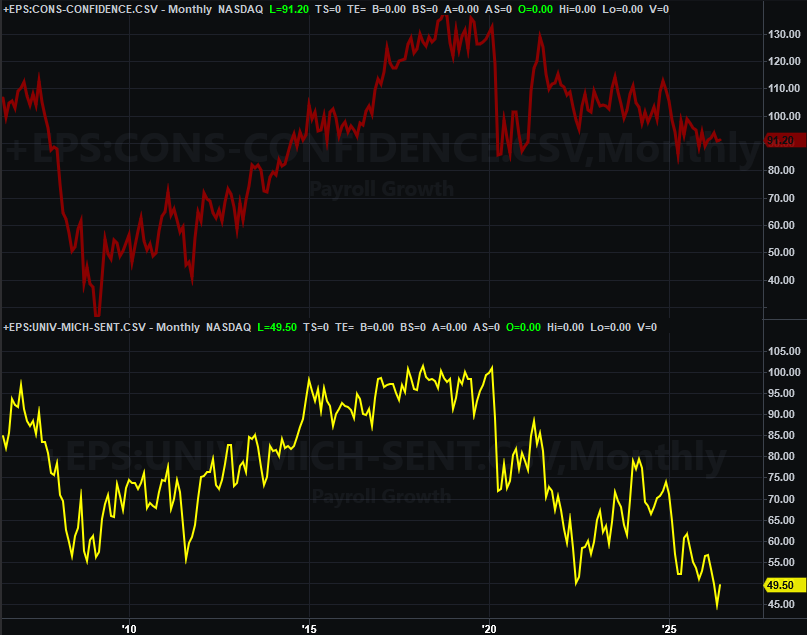
Source: Conference Board, University of Michigan, TradeStation
On Thursday, keep your eyes and ears open for last month’s personal income and personal spending changes. This is data the Federal Reserve’s Open Market Committee (FOMC) takes very seriously when making interest rate decision. Although it won’t be available until after the Fed has made its decision this time around, it will still play a role for the next scheduled decision in September. As it stands right now, incomes and price increases are both above norm, which would normally invite a rate hike. The Fed doesn’t seem comfortable doing so just yet, however, even though this particular data suggests it should.
Stock Market Index Analysis
As we usually do, let’s start this week with a look at the daily chart of the S&P 500, since it best illustrates the subtle but serious damage done last week. With Thursday’s tumble and Friday’s failure to recover from it, the S&P 500’s weekly loss of 0.6% pulled the index below its 20-day (blue) and 50-day (purple) moving average lines. That’s not catastrophic yet, but it’s moving in that direction. The index keeps peeling back under these lines, having failed to move above the horizontal ceiling that’s now formed at 7,574 (green, dashed).
S&P 500 Daily Chart, with Volume and VIX 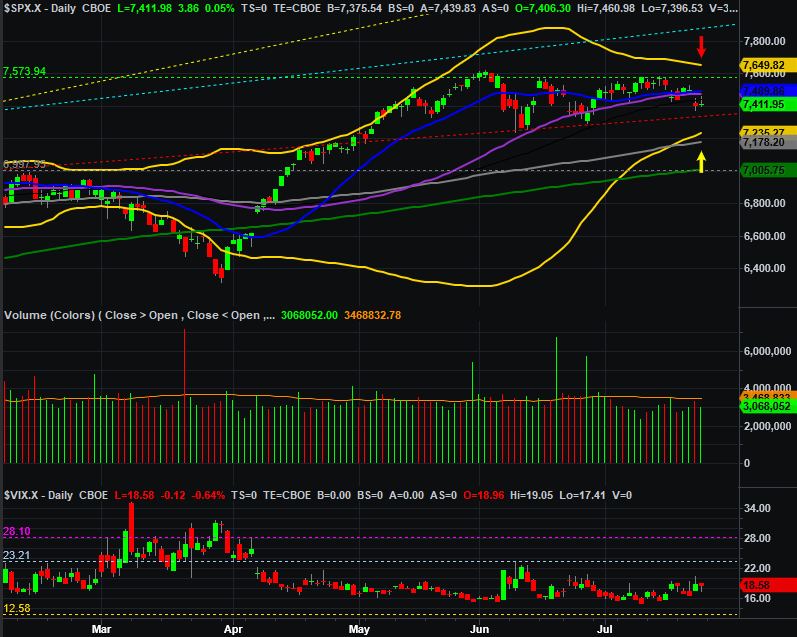
Source: TradeNavigator
The weekly chart of the S&P 500 puts things in perspective. Last week’s slight tumble quietly pulled the index below a rising support line (yellow, dashed) that had been keeping it propped up since mid-June. And, as a result, we finally got the bearish MACD crossunder (blue, circled) that’s been brewing for a while. The weekly chart also reminds us the ebb-and-flow pattern is ready to lead into an ebb; there’s room for the S&P 500 to keep falling before longer-term technical support is found in the low-7,000 area… where the 200-day moving average line (green) is, and where the technical support that extends all the way back to early-2025 (red, dashed) will soon be.
S&P 500 Weekly Chart, with MACD and VIX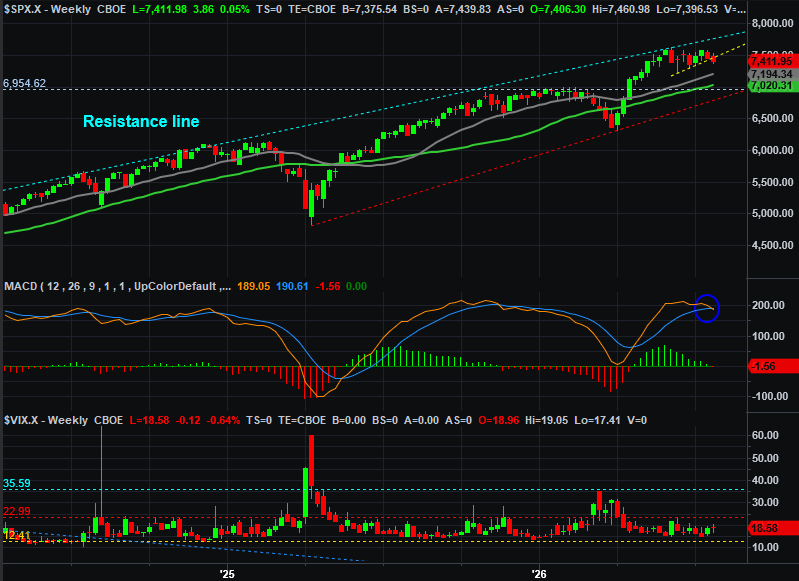
Source: TradeNavigator
For the S&P 500 to slip into real trouble though, the VIX still needs to break above its horizontal ceiling at 23.0 (red, dashed).
The NASDAQ Composite is in slightly worse shape. It broke under its 20-day (blue) and 50-day (purple) moving averages two weeks ago, and never got back above them to pull back under them this week. In fact, it looks like the 20-day moving average line acted as a technical ceiling last week (circled). Still, the horizontal floor at 24,976 (green, dashed) appears to be holding up as a technical floor, even if it is under some serious pressure right now.
NASDAQ Composite Daily Chart, with Volume and VXN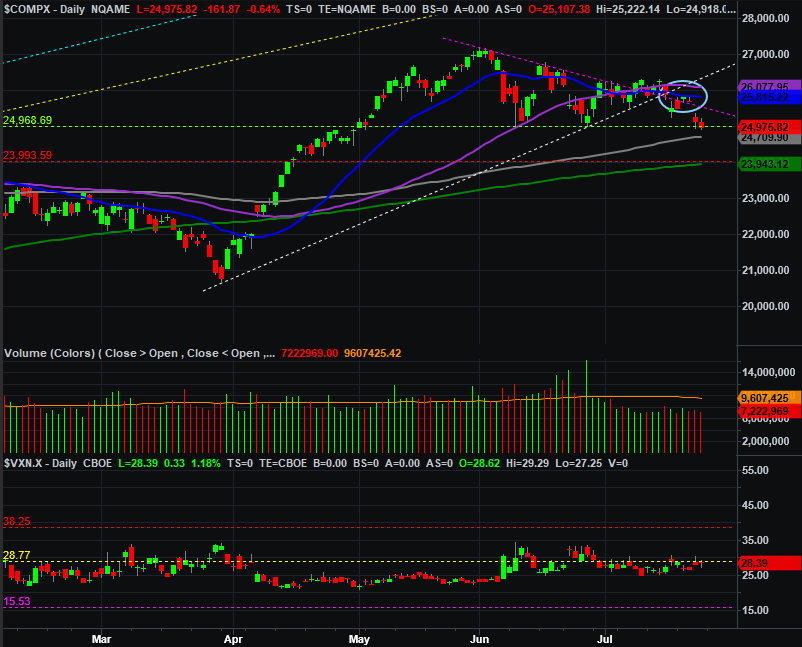
Source: TradeNavigator
The weekly chart of the NASDAQ Composite tells us more. As we can see here, a converging wedge (framed by purple and yellow dashed lines) had actually been forming since the middle of last month. Last week, the index broke under the lower edge of this pattern. It’s not catastrophic yet; the 100-day moving average line (gray) at 24,729 could still become a floor. There’s clearly some bearish momentum forming here, marked by the MACD crossunder that materialized two weeks ago (circled).
NASDAQ Composite Weekly Chart, with MACD and VXN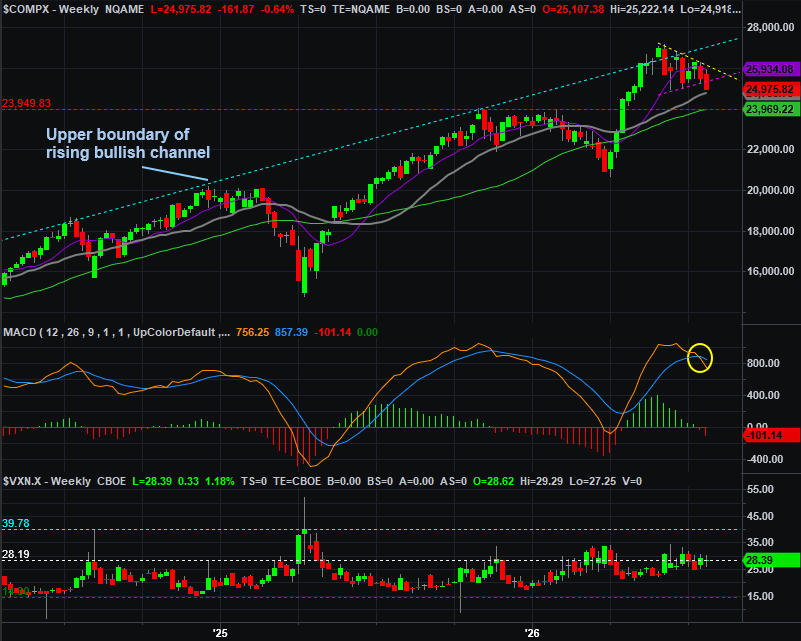
Source: TradeNavigator
Like the S&P 500’s VIX, the NASDAQ’s VXN has surprisingly not moved higher. One would have expected it to by now, particularly with last week’s 2.1% tumble from the composite. That’s ok though. It just leaves that much more room for the NASDAQ itself to make a full-sized correction before a spike from the VXN signals a market bottom… a bottom that as of right now is most likely to materialize around 23,969, where the 200-day moving average line (green) waits.
Again though, there’s still plenty of technical ways for both indexes to fund technical support before slipping past the point of no return. Your best bet from here is arguably doing nothing and waiting to see who plays their cards first this week, and how they play them. Mostly the market’s trapped in between a great deal of support and resistance, and could bounce around for a while testing all the different boundaries in play now that all the key moving average lines are converging.