It was hardly a catastrophic loss, but it certainly wasn't a gain either. The S&P 500 gave up a couple of points during last week's holiday-shortened action, with the weight of the incredible gains seen since late December clearly keeping many would-be buyers on the sidelines.
This is a point where the market has to make a tough decision. Any more upside progress will most likely be a meltup that takes shape in defiance of the market's valuation, rather than being driven by it. But, given the tepid (and fading) volume seen during this last piece of the 17-week advance, most signs indicate this past week's slowdown is a preamble to a pullback.
Maybe.
We'll examine what's working and not working for the market below, as always, after running down last week's economic news and previewing this week's reports.
Economic Data Analysis
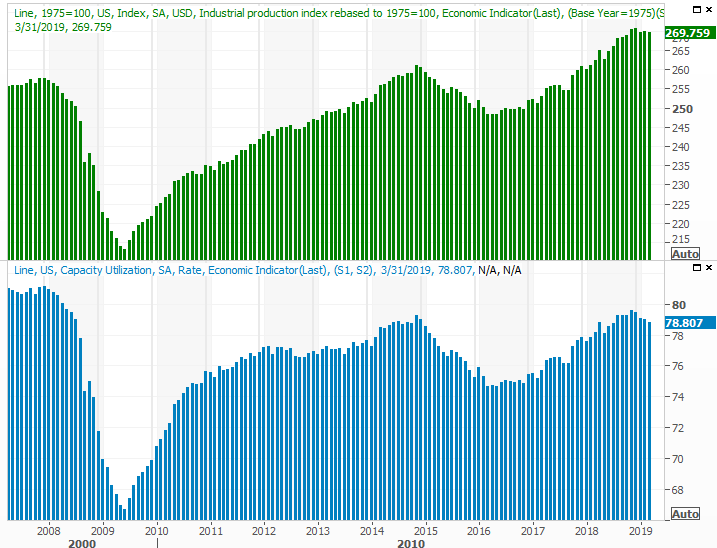
Last month's industrial activity was a bit of a disappointment, at least according to the Federal Reserve's data. Capacity utilization fell from 79.0% to 78.8%, versus an expected rise to 79.1%. And, industrial production fell 0.1% versus an expected improvement of 0.2%. Production was up 0.1% on February.
Industrial Production and Capacity Utilization Charts
 [1]
[1]
Source: Thomson Reuters
This has officially become a concern. Both figures have been edging lower for three months now, even though the market's been in rally mode. The capacity utilization slump along with the slowing industrial production should take something of a toll on the earnings reports due this month and next.
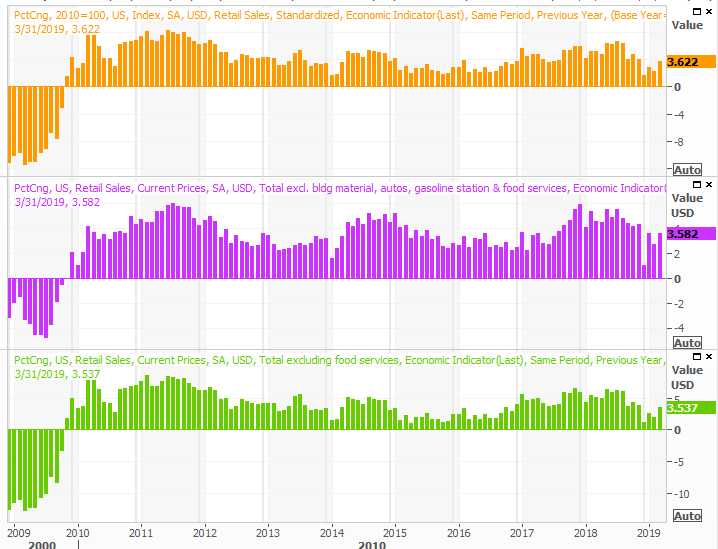
On Thursday we got March's retail sales figures. You'll recall December's report was alarmingly weak. Since then though, consumption has been improving. It's back in full swing now, with the year-over-year improvements almost back to the heyday figures of 2017 and most of 2018.
Retail Sales Growth Charts
 [2]
[2]
Source: Thomson Reuters
Consumer spending isn't the problem it was being made out to be in January.
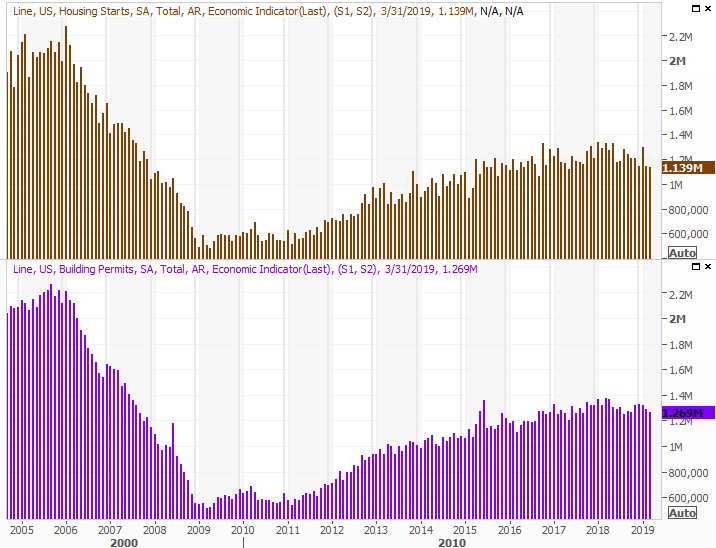
Finally, on Friday we got last month's housing starts and building permits. Economists were calling for a modest improvement to February's tallies, which still wouldn't have snapped the data trends out of their slowdown. Instead, we saw another round of modest declines.
Housing Starts and Building Permits Charts
 [3]
[3]
Source: Thomson Reuters
Everything else is on the grid.
Economic Calendar
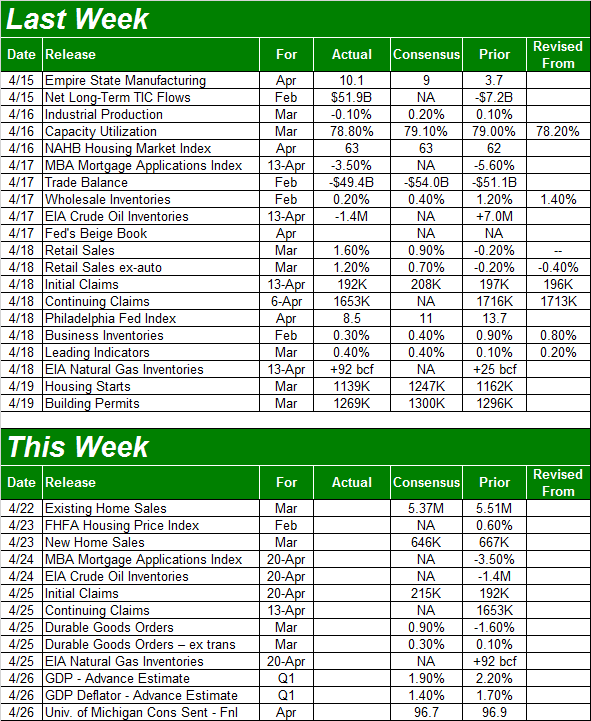 [4]
[4]
Source: Briefing.com
This week is going to help round out the real estate picture. On Monday we'll hear last month's existing-home sales report, followed by new-home sales numbers on Tuesday. Though both raced higher pretty firmly in February, economists are calling for slight declines for last month.
New, Existing Home Sales Charts
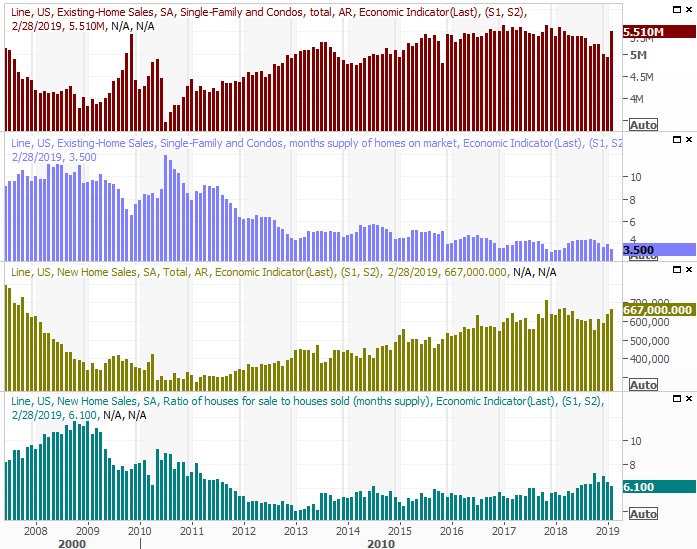 [5]
[5]
Source: Thomson Reuters
Don't be surprised if these numbers roll in better than expected.
To that end, on Tuesday we'll get February's FHFA Housing Price Index figure. Though price-appreciation has been slowing down, it's still making forward progress. Higher home prices may be part of the reason purchases are tepid, but a balanced trade-off may be what's best.
Home Price Index Charts
 [6]
[6]
Source: Thomson Reuters
We won't get the S&P Case-Shiller Home Price Index update until next week. We will, however, get the first estimate of Q1's GDP growth rate. The pros are expecting a slower pace, of 1.9%, after Q4's also-slower pace of 2.2%. Given the lull in industrial production and capacity utilization, the outlook for Q1 is probably on target.
GDP Growth Charts
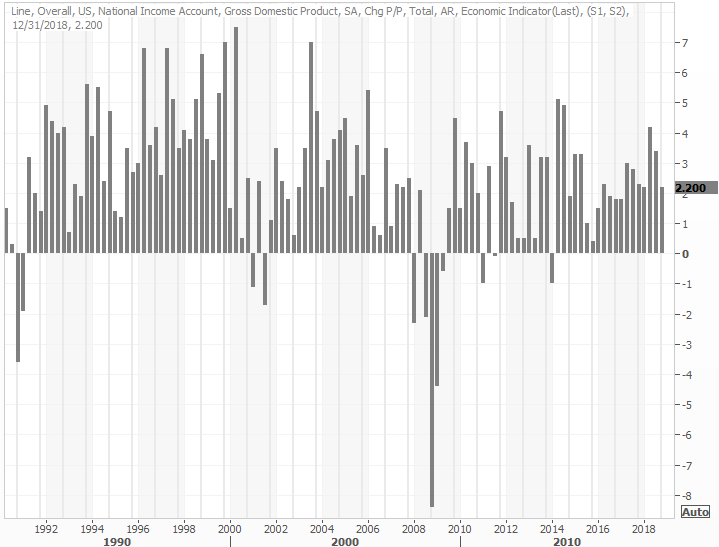 [7]
[7]
Source: Thomson Reuters
Stock Market Index Analysis
Even with just a quick glance at the weekly chart of the NASDAQ Composite, the market's problem becomes clear – too much, too fast, with fading buying interest the higher stocks go. Volume was going to be poor no matter what.
NASDAQ Composite Weekly Chart, with Volume
 [8]
[8]
Source: TradeStation
Even the one relieving aspect of the NASDAQ's chart isn't all that relieving. That's the VXN. It's not yet back to its absolute floor around 11.8, but last week's low of near 15.0 is still a major technical support level in and of itself. Reaching that market doesn't necessarily mean the market can't keep on climbing. But, it does make it tougher to do so.
Zooming into the daily chart of the NASDAQ we don't learn a whole lot more, but we do gain some clarity on how the rally is slowing down. We also know exactly where any pullback is apt to find support. Any of the moving average lines in the rearview mirror could quell any selling.
NASDAQ Composite Daily Chart, with Volume
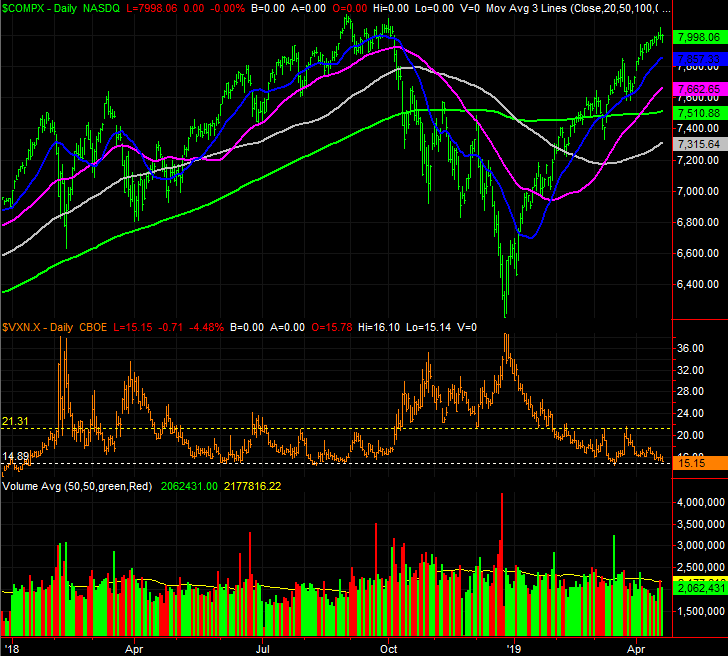 [9]
[9]
Source: TradeStation
The same goes for the S&P 500's daily chart.
S&P 500 Daily Chart, with Volume
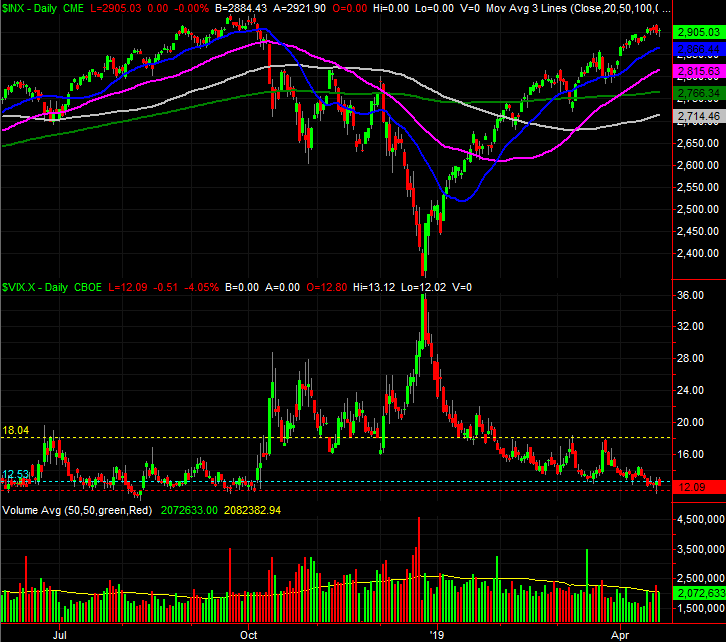 [10]
[10]
Source: TradeStation
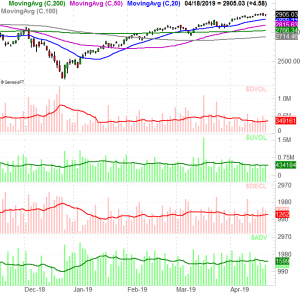
The flaw, and fly in the ointment, as volume… or more specifically, a lack of bullish volume. The relative number of advancers (compared to decliners) isn't terribly impressive either.
Though not exceedingly so, the recent bullish volume has been below average, while the bearish volume has been above the recent average. The market itself hasn't lost ground, but depth and breadth – volume and advancers/decliners – usually change direction before the market tide does. A few more days of the same would become a net-bearish condition. We'll talk more about that shift to net-bearish depth and breadth if and when the time comes.
S&P 500 Daily Chart, with NYSE Advancers, Decliners, Up and Down Volume
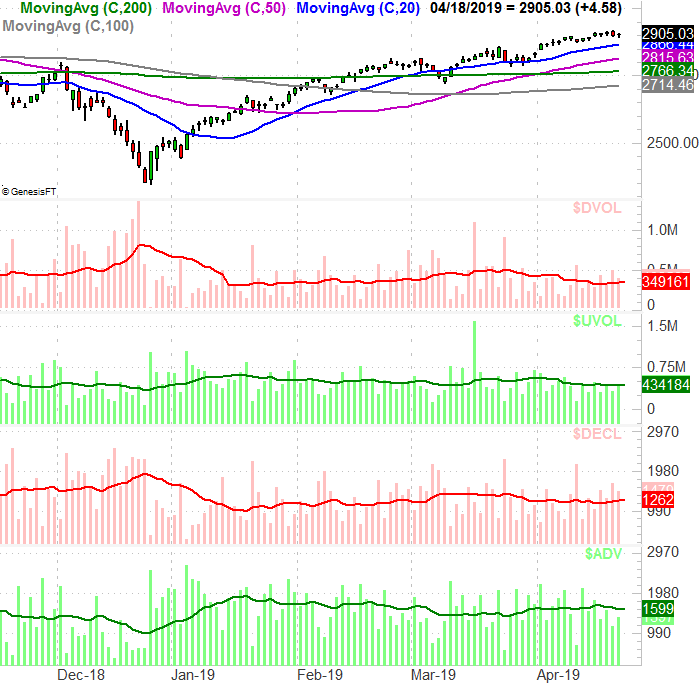 [11]
[11]
Source: TradeStation
Bottom line? The market isn't in more trouble than it can handle yet. It's not even in a profit-taking mode though it arguably should be. It may not be a buy, but it's certainly not yet a sell. Still, it's curious that the rally effort is slowing down as new highs come into sight; the rally back to peak levels from December's deep low was relatively easy. Stocks are running out of runway, but the wheels aren't off the ground yet, and airspeed is slowing.
The key is still the VIX and the index's moving average lines. The VIX would need to break above its recent ceiling around 18.0, while the S&P 500 would need to start breaking under its moving average lines to even consider trading a selloff. In the meantime, if Q2's earnings and industrial productivity don't perk up, a small blip could become more serious. First things first though.
This remains a day-to-day affair. Headlines are still mostly in charge, though less so now that stocks are strained under the weight of big gains.