It didn't seem likely, and it may not make a lot of sense. But, the market managed to tack on more gains las week. In fact, it accelerated a rally that's been in place since late June.
It makes an already-tricky situation even trickier. The COVID-19 pandemic clearly isn't going to be economically devastating, so the snap-back rally from March's selloff makes enough sense. The size and scope of the S&P 500's 60% gain from March's low, however, ignores the undeniable fallout from the contagion.
In other words, things aren't quite as solid as stocks would suggest they are. Yet, there it is – the bulls won't quit. You can't fight the tape, even if it feels like you should.
We'll take a more detailed look at everything below, including a look at why we should be even more worried about a pullback now than we were a month ago. First though, let's recap last week's big economic announcements and preview the big economic news in store for this week.
Economic Data Analysis
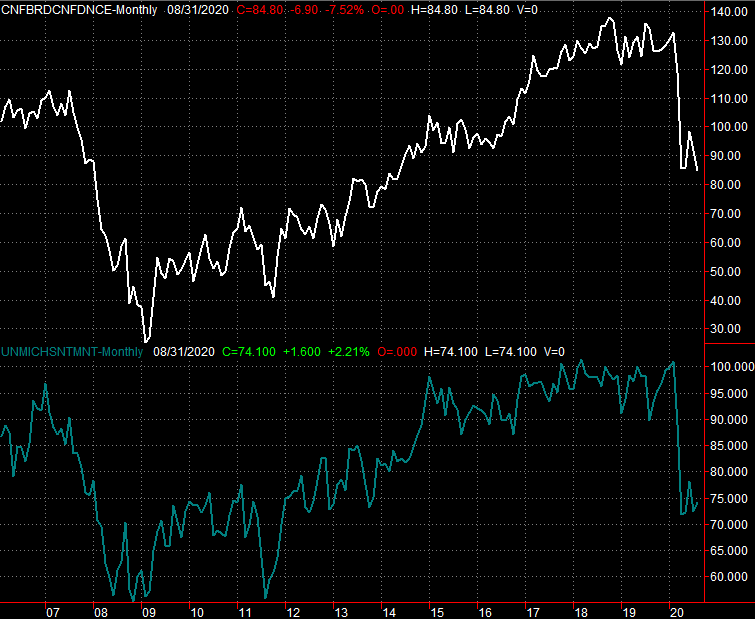
Given the market's rebound from deep lows in March (as was noted, the coronavirus contagion is awful, but not devastating), one would think consumer sentiment would have recovered well. Consumer spending certainly has. But, that's not been the case. The Conference Board's measure of sentiment actually fell to a multi-year low of 84.8 this month after teasing recovery move a month ago. The Michigan Sentiment Index edged slightly higher for August, but not meaningfully so… and remains near multi-year lows.
Consumer Sentiment Charts
 [1]
[1]
Source: Conference Board, University of Michigan, TradeStation
This may be more of a liability than it seems. Enough people continue to have doubts about the future, even if investing and consumption remain strong.
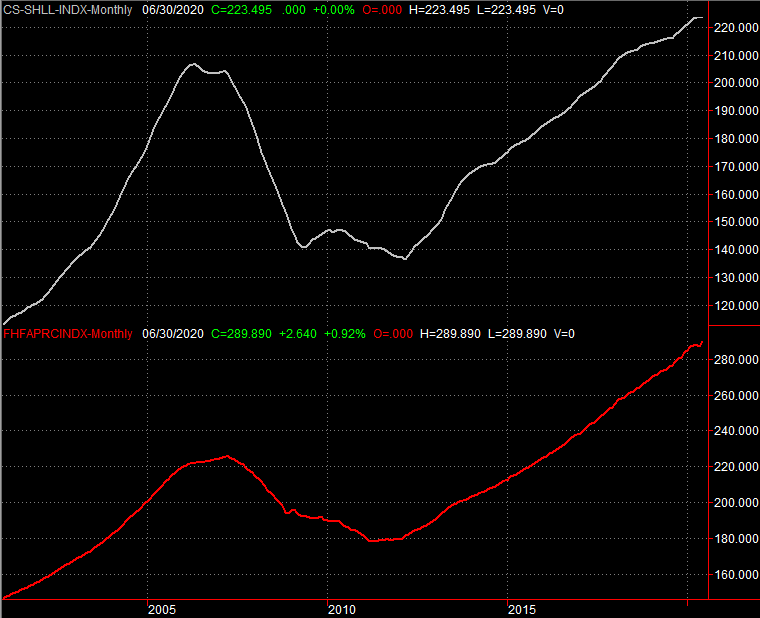
So do home prices – mostly. The S&P Case-Shiller Home Price Index ended June at 3.5% higher than year-earlier levels, but didn't make any gains between May and June. The FHFA Housing Price Index was up 0.9% between May and June, and has renewed a long-term uptrend.
FHFA Housing Price Index & Case-Shiller Home Price Index Charts
 [2]
[2]
Source: FHFA, Standard & Poor's, TradeStation
Yes, record-low mortgage rates are in play. Consider the entire picture though. Despite stunningly high unemployment and legitimate worries of a lingering economic headwind, homesellers are still getting good prices when they sell.
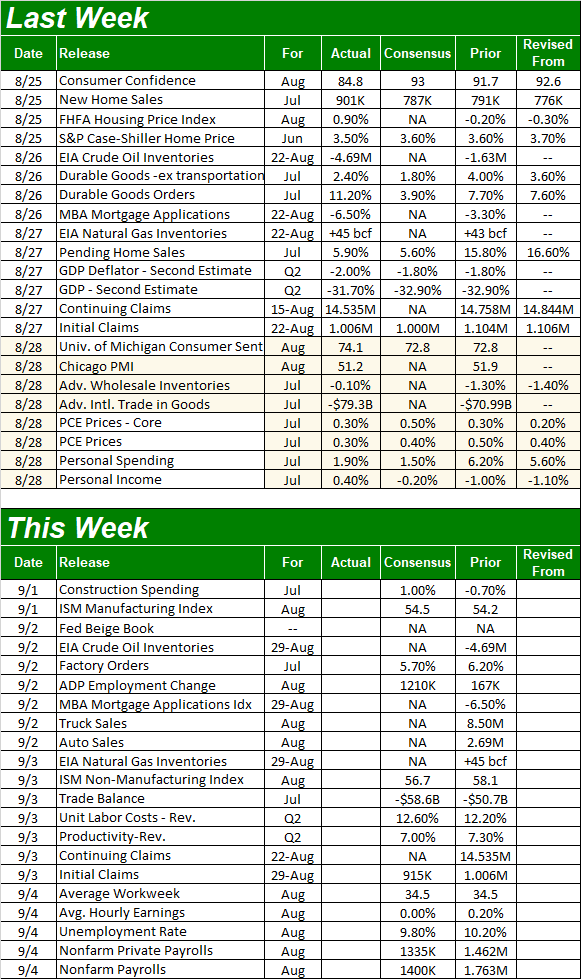
Everything else is on the grid.
Economic Calendar
 [3]
[3]
Source: Briefing.com
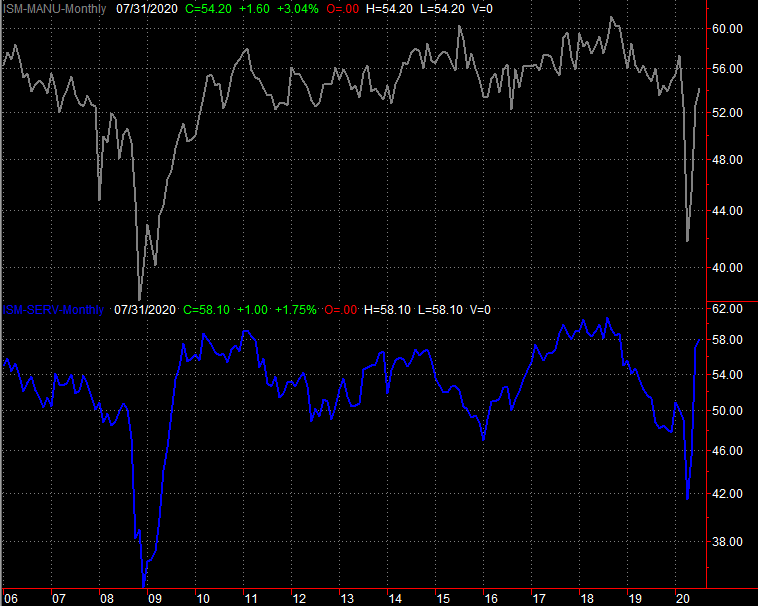
This week is chock-full of news, ending with the grand finale of August's job numbers. Before we get to that report though, we'll start a look at the ISM data. That party starts on Tuesday with August's ISM Manufacturing number, followed by the ISM Services Index due on Thursday. Each is expected to roughly match July's levels. A wider variation could bump the market around a little.
ISM Manufacturing, Services Index Charts
 [4]
[4]
Source: Institute for Supply Management, TradeStation
Bear in mind that readings above 50 are still considered positive. Only readings below 50 are technically a sign of weakness. But, it's difficult to pretend traders also aren't thinking in relative terms right now.
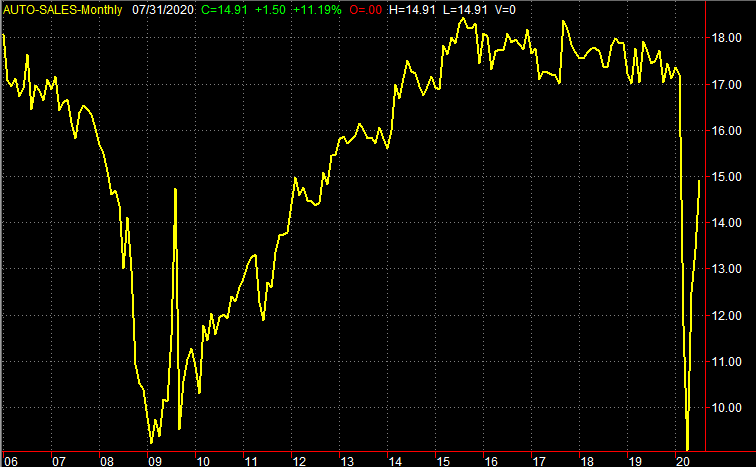
We'll also hear about August's auto sales starting this week. They've not yet fought their way back to pre-COVID levels, but given the difficulty of making vehicles and getting on car lots, the previous annualized pace of 14.9 million (U.S.) isn't too shabby. That's one of the other signs that indicates confidence on behalf of consumers, even if they're not saying they're confident.
Auto Sales Chart
 [5]
[5]
Source: St. Louis Federal Reserve, TradeStation
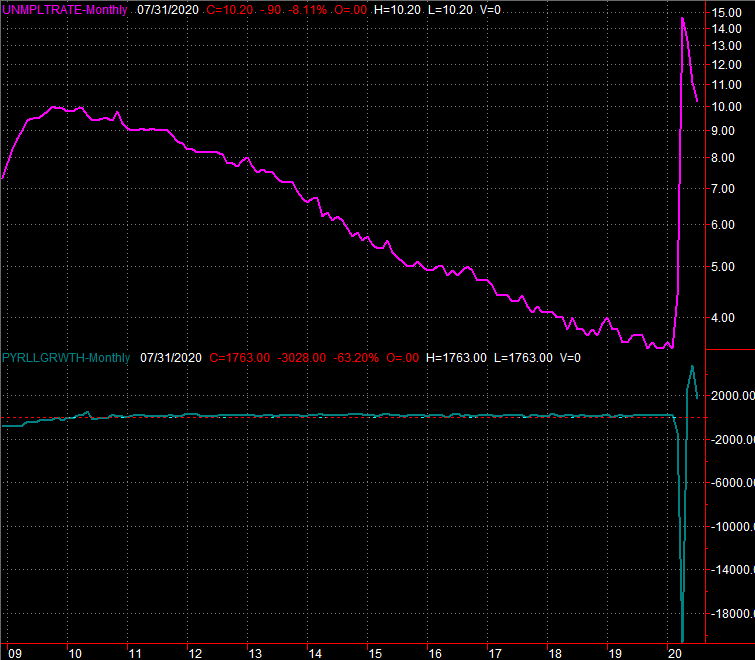
This week's biggie, of course, will be unemployment and payroll growth. Economists are calling for more progress, albeit at a slower pace of recovery. The unemployment rate is projected to come in at 9.8%, thanks to the addition (net) of 1.4 million jobs. A month ago, that number was 1.76 million.
Unemployment Rate, Payroll Growth Chart
 [6]
[6]
Source: St. Louis Federal Reserve, TradeStation
Stock Market Index Analysis
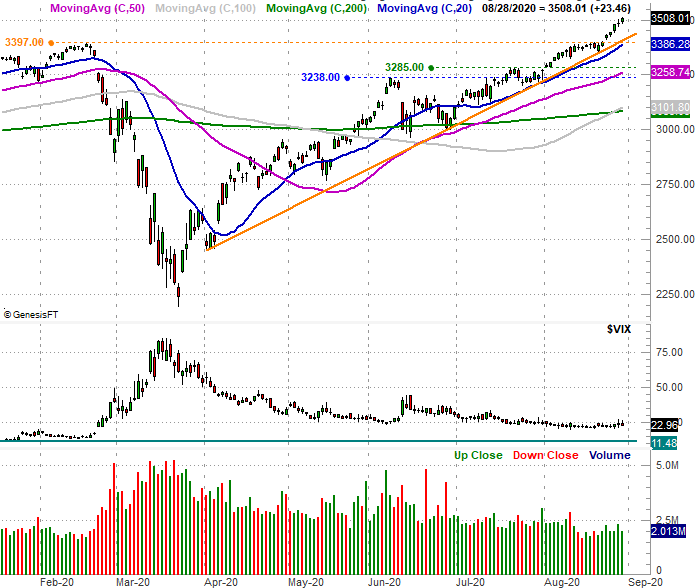
The daily chart of the S&P 500 isn't a tough one to decipher. A ceiling was starting to form at February's peak near 3397, but the bulls blew past it – with an opening gap – on Monday after pushing up and off of the support line that connects all the key lows since early April (orange). They never really looked back. Standing in front of that moving train woulda hurt.
S&P 500 Daily Chart, with VIX and Volume
 [7]
[7]
Source: TradeNavigator
The weekly chart tells the same story, perhaps with a little more perspective. That is, the rally seems to have accelerated once it broke past resistance.
S&P 500 Weekly Chart, with VIX and Volume
 [8]
[8]
Source: TradeNavigator
There are a couple of noteworthy nuances of the breakout though. One of them is the lack of volume behind last week's advance. The other is the fact that the VIX, curiously, didn't move significantly lower when stocks moved higher last week. In fact, the VIX didn't move lower at all. It moved a little higher.
In some regards this is a good thing (assuming "good" is the same thing as "bullish"). It suggests these traders aren't blindly plowing into an uptrend, setting themselves up for pain if-and-when things suddenly take a turn for the worst. There's at least a little caution in the mix, which is a healthy thing… or at least can be. In this case, it may only be a coincidence.
Take a look at the daily chart of the NASDAQ Composite to understand why. It was up last week as well, gaining 3.3% during the five day stretch. It didn't end the week on a high note though, with the bullishness seen early in the week fading. That may be a function of the fact that the composite is now up 76% from its March low. The NASDAQ is doing better on the volume front though, by virtue of its bearish daily volume mostly sinking since last month. It's equally uneven from one day to the next, but there's more bullish volume within the NASDAQ's names than not even if the composite didn't finish the week strong.
NASDAQ Composite Daily Chart, with VXN, Up and Down Volume
 [9]
[9]
Source: TradeNavigator
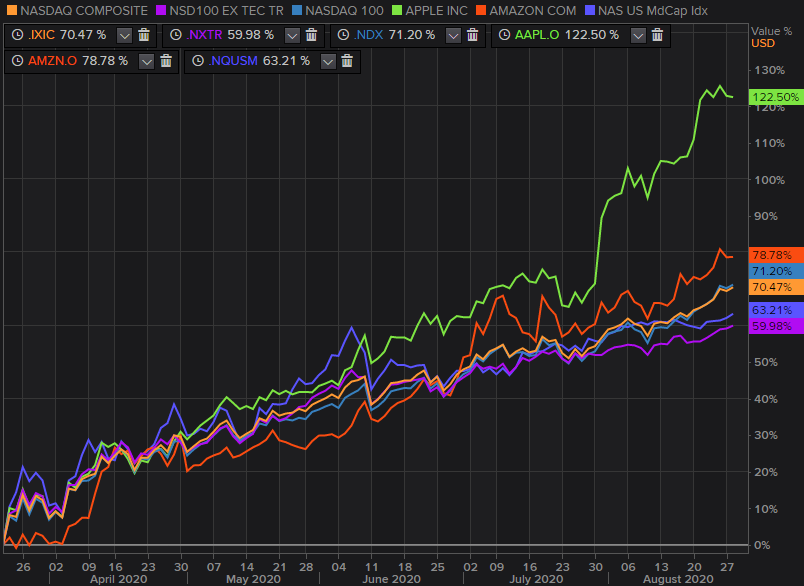
Here's another (potential) problem with coming to a sweeping bullish conclusion on the broad market simply because the NASDAQ is broadly leading the way: Most of its stocks aren't doing that well. Take out the very biggest names of the tech-heavy index – namely Apple and Amazon — and you'll find there's actually not a great deal of participation in this really. The NASDAQ 100 ex-Tech Index is lagging most other NASDAQ indices and most of the heavyweight names in the composite.
NASDAQ Composite/NASDAQ 100 Indices Performance vs. Apple,. Amazon, Mid Caps
 [10]
[10]
Source: Thomson Reuters Eikon
It's a problem simply because the market's most popular names can't do all the heavy lifting indefinitely.
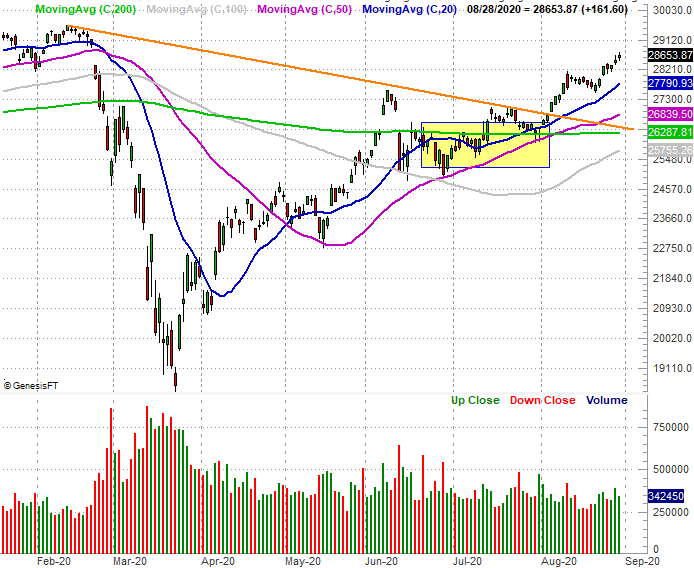
Enter the Dow Jones Industrial Average, which didn't do too badly last week either. It gained 2.6% over the course of the past five trading days. But, it's got plenty of room to keep adding to its current level should traders decide to rotate out of the NASDAQ's most overbought names in search of safety. As well as the Dow's done since March, it's yet to even reclaim its February peak.
Dow Jones Industrial Average Daily Chart, with Volume
 [11]
[11]
Source: TradeNavigator
You'll also notice that, while still a little below average, the Dow's volume is gaining as it moves higher. There are more buyers moving into these names right now, perhaps in anticipation of the aforementioned rotation. Some of that buying might be in anticipation of upcoming changes to the Dow's 30 stocks, but bear in mind, that same change involves selling too.
One last thing… we're about to start a month that's historically a rough one for stocks, and this year, we're set up for an especially rough September. Know that if more gains are added from here, they're added against the odds.
S&P 500 Average Performance By Month, vs. 2020 and YTD Cumulative Data
 [12]
[12]
Source: MoneyChimp
This all admittedly makes for a tricky puzzle to piece together; the only thing we've done here is put the pieces on the table. Unfortunately, that's about all we dare do right now. There's just too much uncertainty. We'll only reiterate that in the event of market weakness, keep your eyes on the same technical support levels we discussed last week. That's the lower boundary of rising trading channels (orange) and the 20-day moving average lines (blue).
