For the fourth week in a row stocks lost ground, defying the market's tendency to rally in the week between Christmas and New Year's. From a momentum trader's perspective, this is a problem.
Maybe it's just the calendar. Although we didn't see the usual Santa Claus rally to wrap up 2022, maybe it was just loss-harvesting… last-minute sells to lower the year's total taxable income (and clean up a portfolio's dogs to start the new year with a clean slate). Or, maybe investors just don't have any confidence in where things are going.
The good news is, the indices are still holding above key technical floors… barely.
We'll look at this on-the-bubble market in a moment below. First, let's review last week's most important economic news and preview what's coming this week. Spoiler alert: December's jobs report is due on Friday. Forecasters aren't looking for much.
Economic Data Analysis
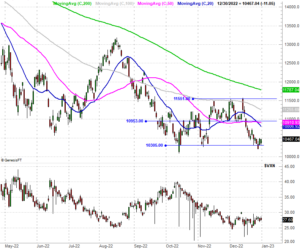
There was really only one kind of data dished out last week… real estate, and real estate prices, to be specific. For the month of October, the S&P Case-Shiller Home Price Index fell 3.1% year over year, and though the FHFA Housing Price Index ticked a little higher in October, its bigger-trend is still … well, stalled. And, we know mortgage applications and home sales have weakened in the meantime.
Home Price Charts
 [1]
[1]
Source: Standard & Poor's, FHFA, TradeStation
Prices aren't the only factor to consider when taking the temperature of the housing market. As was noted though, other real estates metrics have also been slipping for several weeks. Falling prices just confirm this market is drying up in a hurry. The fact that we're just now hearing October's home price data also opens the door to the possibility that pricing power is even much, much weaker than it seems from these numbers.
Everything else is on the grid.
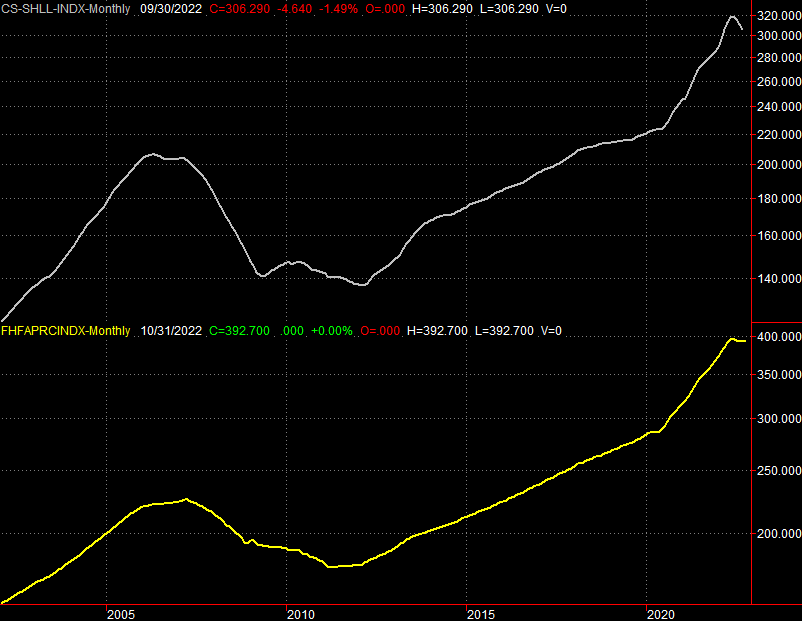
Economic Calendar
 [2]
[2]
Source: Briefing.com
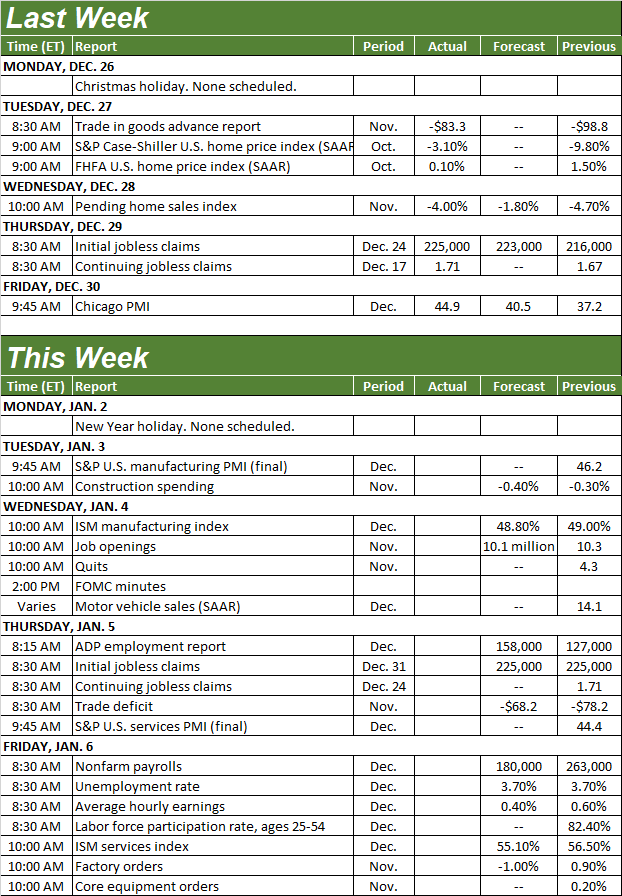
While Friday's jobs report will be well-watched, it's not the only important data coming this holiday-shortened week. On Wednesday we'll hear December's ISM Manufacturing Index data, and on Friday we'll get the services version of the ISM's economic barometer. Both are in downtrends, although the services index looks like it's at least toying with a reversal. Economists expect more of the same (in both cases, for better or worse) this time around.
ISM Services, Manufacturing Index Charts
 [3]
[3]
Source: Institute of Supply Management, TradeStation
While there's nothing to chart with either, note that on Wednesday we'll hear about November's job resignation, and also be able to review the minutes from the FOMC's most recent meeting. While it's not a scheduled potential rate-change event, the language the Fed uses — and changes — may offer some insight as to what the Fed's governors are thinking.
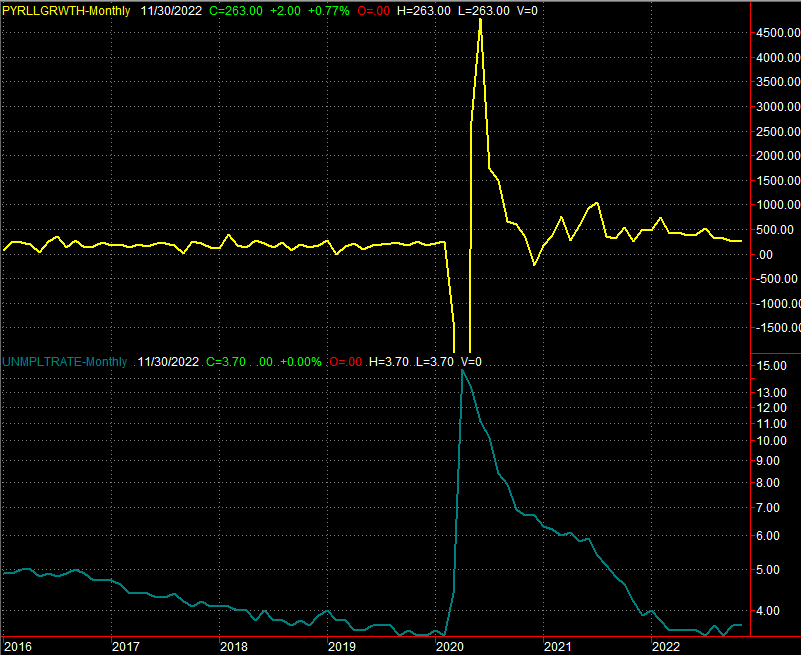
Friday, of course, is the week's Big Kahuna. The forecast is for 225,000 new jobs… a slight improvement on November's figure. Yet, the unemployment is projected to actually grow from 3.7% to 3.8%, reflecting a shakeup within the jobs and displacement certain kinds of workers. It's not a bad outlook per se, as the figures in and of themselves are firm in light of the circumstances. There's little more assistance more improvement in the jobs market can provide for the economy, however.
Payroll Growth and Unemployment Rate Charts
 [4]
[4]
Source: Census Bureau, TradeStation
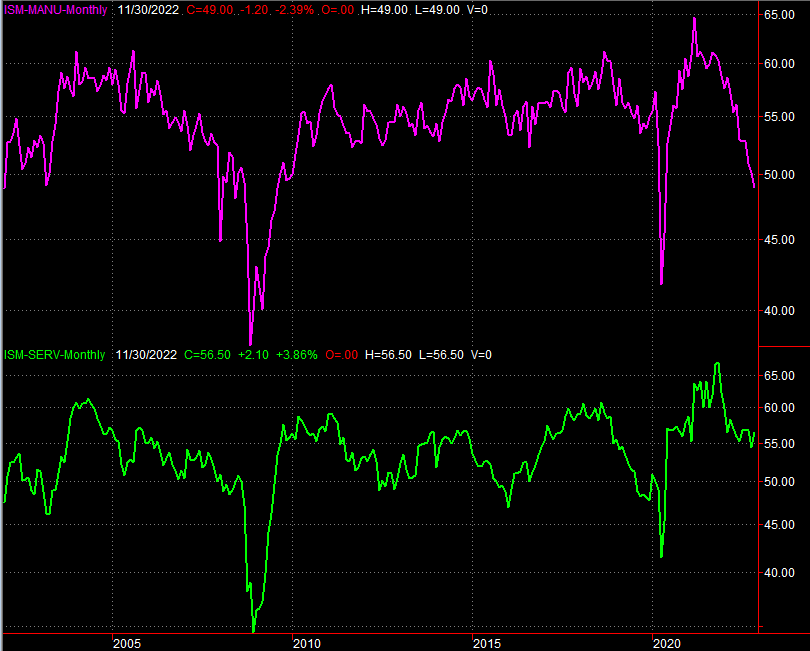
Stock Market Index Analysis
The bulls drew a line in the sand when they absolutely had to. But, that's the only bullish thing that can be said about the market here.
Take the NASDAQ Composite as an example (and arguably the prime example). We pointed to a horizontal floor around 10,305 last week, and that line once again came into play. The composite closed below that mark on Wednesday, but opened above it then remained above it on the final two days of last week. In fact, it looks like that level is serving as a pushoff point now.
NASDAQ Composite Daily Chart, with VXN
 [5]
[5]
Source: TradeNavigator
That may only be temporary. The NASDAQ remains on the wrong side of every other possible indicator line, including the all-important 20-day (blue) and 50-day (purple) moving average lines near a major floor/ceiling around 10,950. Last week's bit of bullishness may only be a flash in the pan… an inevitable pause from the selloff because a major technical support level was brushed. We may even see stocks get started on a bullish foot this year. Until the NASDAQ Composite can actually clear the convergence of resistance around 10,950 though, we can't afford to be too encouraged.
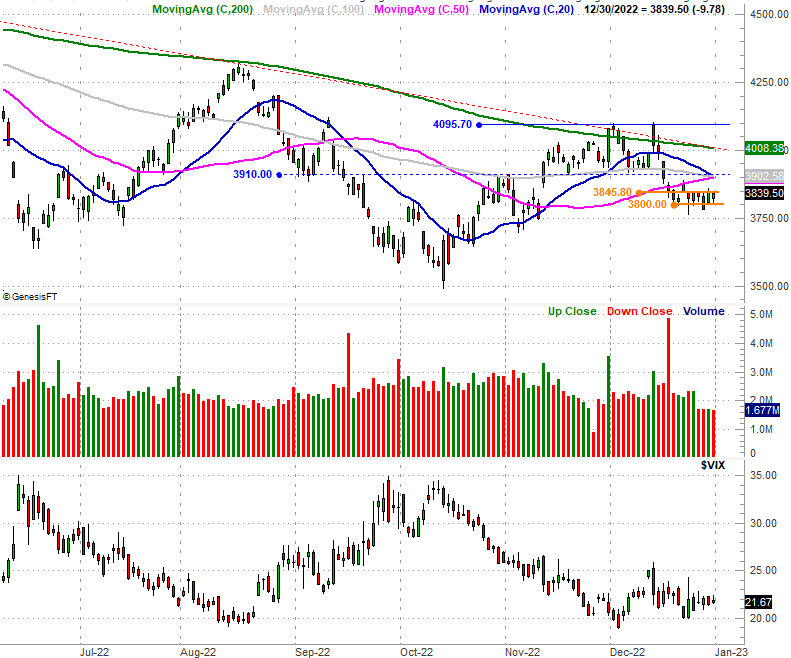
For the S&P 500 that line in the sand is 3846, where the index peaked several times last week (and the week before). Then there's a major convergence of technical resistance right at 3910… and then again around 4008, where the index's 200-day moving average line (green) and the straight-line resistance (red, dashed) going all the way back to last January's high have intercepted. The S&P 500 will have to hurdle all of this for the tide to turn decidedly bullish again. That's no small task.
S&P 500 Daily Chart, with VIX and Volume
 [6]
[6]
Source: TradeNavigator
There is a bastion of hope, however. Notice the bulls have drawn a line in the sand around 3800, near where the index has hit its lows for the past week and a half. This narrow band of support and resistance could be the market's way of setting up slingshot-like action. The question is, which direction will the slingshot push stocks?
The only index doing "well" by any objective standard is the Dow Jones Industrial Average. It's holding above a key convergence of support around 32,300. Still, it closed last week before its 50-day moving average line (purple) and 20-day line (blue), and is still technically in a downtrend.
Dow Jones Industrial Average Daily Chart, with Volume
 [7]
[7]
Source: TradeNavigator
While the tide looks bearish right now, just bear in mind there's a chance a lot of last week's continued selling is selling done to lock in losses for tax-year 2022. The mood might be much different now that we're in 2023. Indeed, the first few days of the new year tend to be bullish ones. Just don't read too much into any such move, as the overall economy is on the defensive and the market's path of least resistance is still to the downside. Any such rally could still be easily up-ended.