When all was said and done last week, the S&P 500 had gained 3.8% from the previous Friday's close, logging a record-high close in the process. The move also stopped — and then reversed — some pretty strong selling suffered over the course of the prior two weeks. Not bad. It looks like traders are anticipating a Santa Claus rally after all. And, they'll probably get it.
If you think the rebound is an ironclad clue that this bigger-picture rally remains bulletproof though, think again. The technical ceilings that were in play last month are still above us, and still pose a threat. They're just a little higher than they were then. Besides, there's still a sense of hesitancy behind all the recent buying.
We'll explore those ins and outs in a moment. First, let's look at last week's biggest economic announcements and then preview what's coming this week. Spoiler alert: Inflation is a growing concern.
Economic Data Analysis
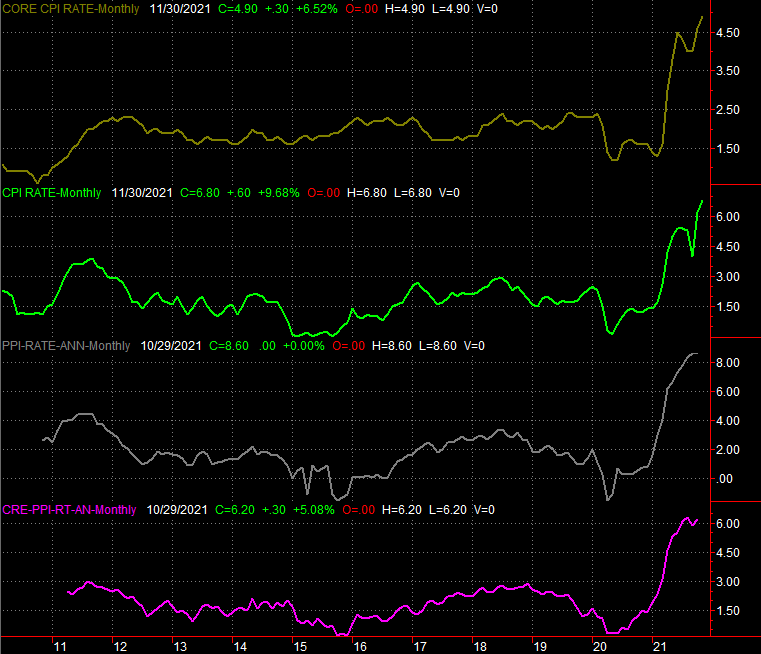
Actually, inflation data is the only data of any real interest released last week, and we only got half of it for last month. That's consumer inflation, based on the CPI. Prices continue to race out of control. On a core (ex-food and ex-gas), annualized inflation now stands at a multi-decade high of 4.9%, while overall consumer inflation November rolled in at a full-year rate of 6.8%…. another multi-decade record.
Inflation Rate Charts
 [1]
[1]
Source: Bureau of Labor Statistics, TradeStation
Almost needless to say, this puts even more pressure on a Federal Reserve that's already working to dial back its stimulus efforts. The FOMC wasn't anticipating imposing its next rate hike until we were well into 2022. That may need to happen sooner than later though. In fact, the FOMC is scheduled to make a decision on Wednesday.
Everything else is on the grid.
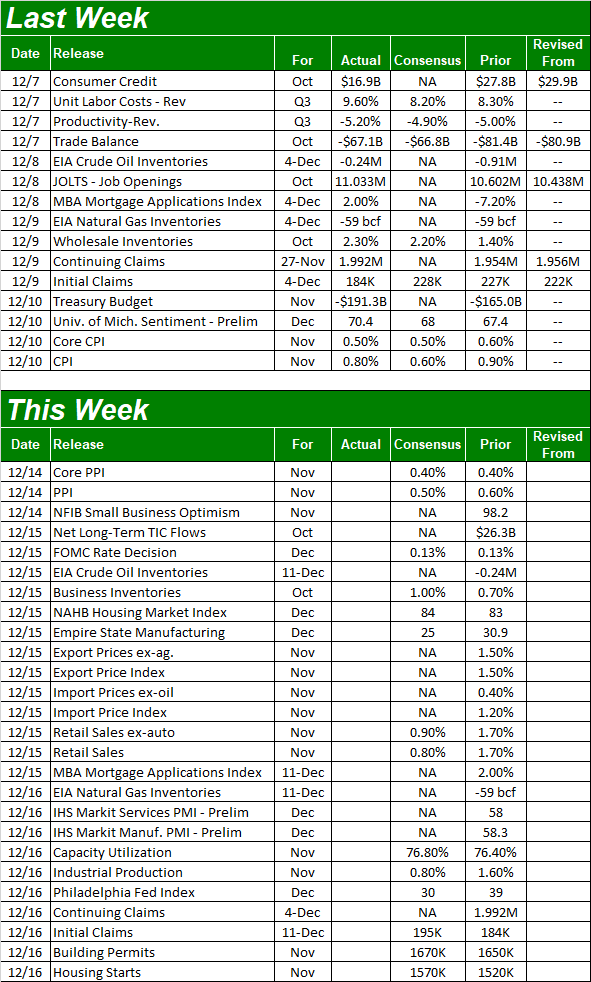
Economic Calendar
 [2]
[2]
Source: Briefing.com
The party starts this week with the other half of the inflation picture; producer inflation figures will be revealed on Tuesday. Look for more of the same price increases.
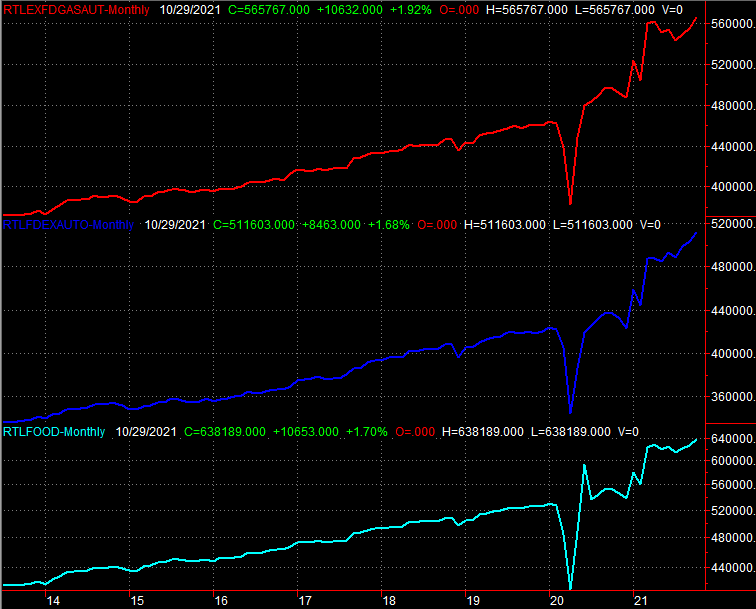
On Wednesday we'll hear last month's retail sales figures. Economists are calling for another month of growth, and though November's won't likely be a strong as October's, they'll still be solid, extending a well-established uptrend that's not just due to inflation-prompted price growth. This is a sign of economic strength.
Retail Sales Charts
 [3]
[3]
Source: Census Bureau, TradeStation
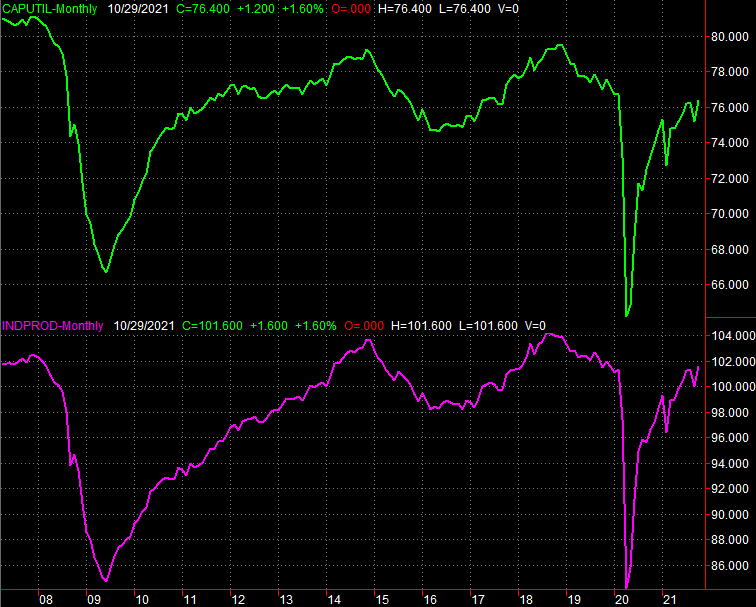
On Thursday we'll get the Fed's capacity utilization and industrial productivity figures for November. The forecasts say we're due for another round of improved data that will lead both to their highest levels since the pandemic too hold. In fact, a good showing could actually take industrial production ABOVE levels seen right before the pandemic began rattling the U.S. economy.
Industrial Productivity and Capacity Utilization Charts
 [4]
[4]
Source: Federal Reserve, TradeStation
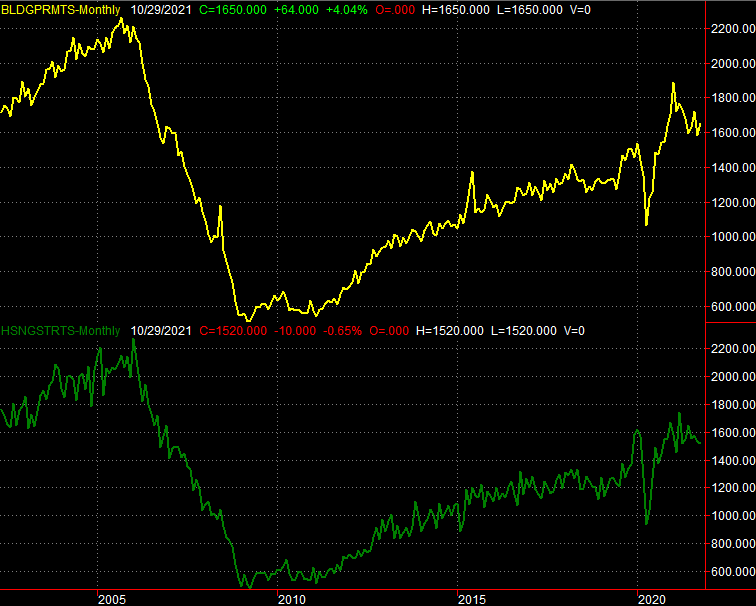
Also on Thursday look for housing starts and building permits to start several days' worth of real estate reporting. Economists are looking for slight increases in November's starts and permits, which would be a welcome reversal of the current weakness on both fronts.
Housing Starts and Building Permits Charts
 [5]
[5]
Source: Census Bureau, TradeStation
Stock Market Index Analysis
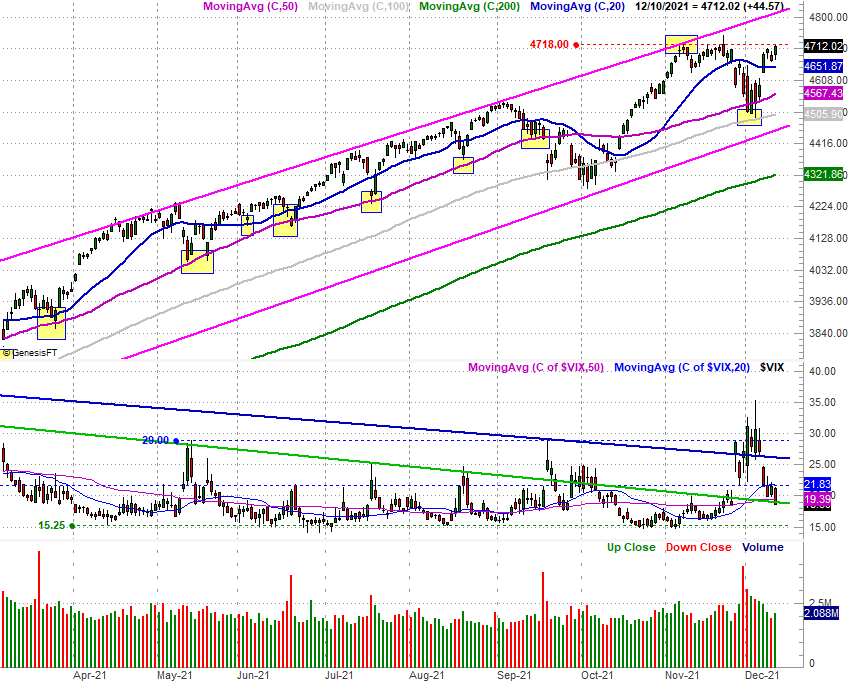
Monday's reversal was firm, and made even firmer by Tuesday's huge jump. Perhaps the most compellingly bullish clue of last week, however, was the bullish end to the week on Friday. Traders had a chance to scale out and play things conservatively headed into the weekend. But, they didn't. They opted to keep buying, viewing the bigger risk as not being in the market. Friday's close of 4712.02 was the index's best close ever.
S&P 500 Daily Chart, with VIX and Volume
 [6]
[6]
Source: TradeNavigator
It's worth noting, however, that the S&P 500 didn't actually make new highs on Friday. It instead appears to be bumping into a ceiling around 4718 (red, dashed), where it peaked a couple of times in November.
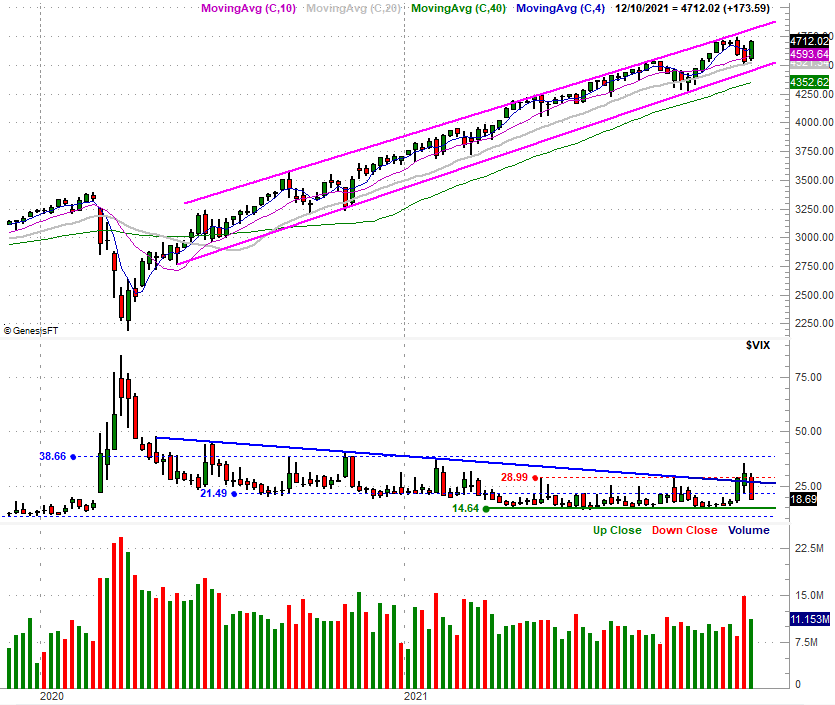
Even so, the index has some room to keep rising before it bumps back into the upper boundary of the rising trading range (framed by pink lines) that's been steering the index higher for months now. This framework is even easier to see on the weekly chart of the S&P 500 below.
S&P 500 Weekly Chart, with VIX and Volume
 [7]
[7]
Source: TradeNavigator
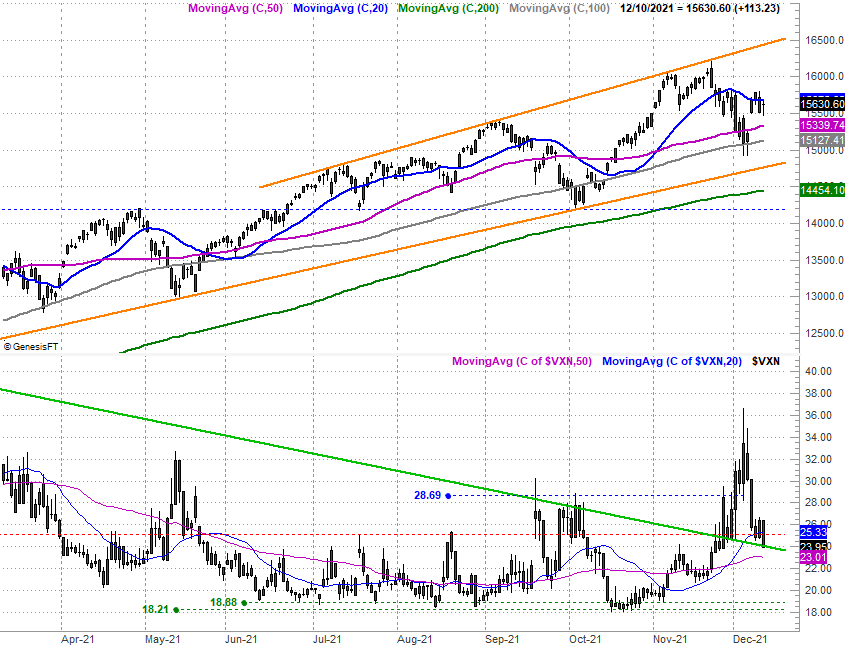
The chart of the NASDAQ Composite looks similar, although not identical. The one glaring difference between it and the S&P 500 is, the NASDAQ was unable to push back above its 20-day moving average line (blue) with last week's bounce, and is nowhere near record-high territory.
NASDAQ Composite Daily Chart, with VXN
 [8]
[8]
Source: TradeNavigator
It's a problem simply because the NASDAQ is supposed to lead the overall market, both higher and lower. It's struggling to keep pace with the broad rally, which may be an indication that the conviction behind last week's buying isn't particularly high.
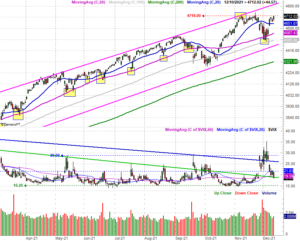
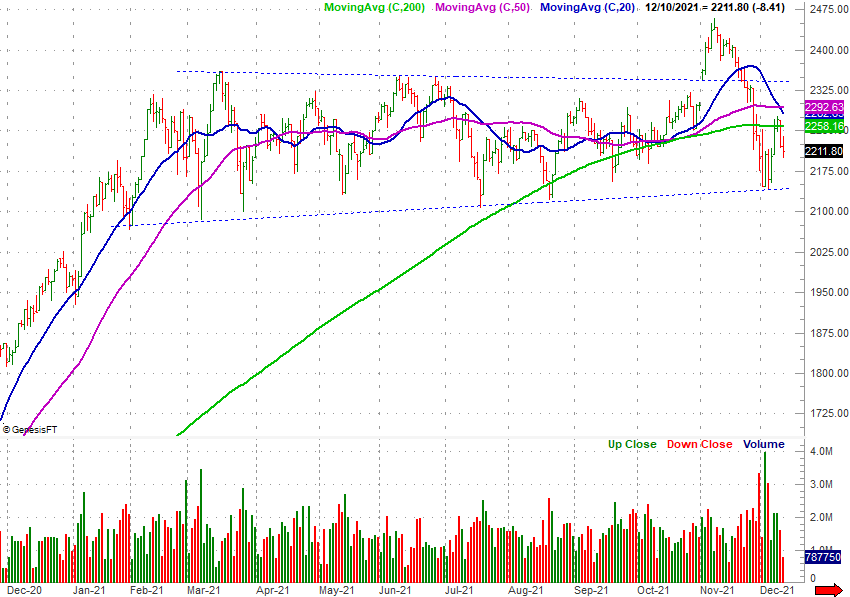
With all of that being said, perhaps the chart most worth watching here and now is actually the Russell 2000 Small Cap Index.
Much like the NASDAQ Composite, small cap stocks are a exaggerated barometer of the overall market's health. Sometimes small caps gain at the expense of large caps (and vice versa). Most of the time though, they move in tandem. That's what makes the clear weakness seen with the Russell 2000 of late so concerning. It was losing ground on Friday, and has fallen back below its 200-day moving average line (green) as a result. It's also within striking distance of falling below a major technical support level (blue, dashed) that connects all the key lows going back to late January. A little more weakness and small caps as a whole may pass the point of no return, inspiring the rest of the market to behave similarly.
Russell 2000 Daily Chart, with Volume
 [9]
[9]
Source: TradeNavigator
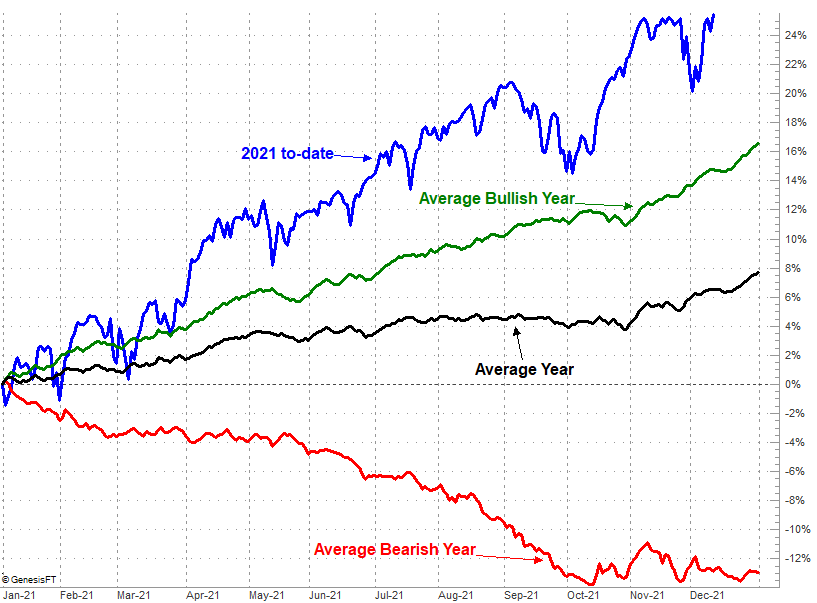
Sure, this is a bullish time of year, so there's plenty of reason to believe stocks can and will continue their current rally. Even then though, this year's 25% year-to-date gain from the S&P 500 is well ahead of where it normally would be at this point. Even factoring in the steep selloff suffered early last year due to COVID-19's arrival in the United States, the market's arguably overextended.
S&P 500 YTD Day-by-Day Gain vs. Average
 [10]
[10]
Source: TradeNavigator
As it stands right now, stocks are about as on the fence as they could possibly be… a 50/50 proposition. The only real action to be taken right now is continuing to keep a close, daily watch on all the floors and ceilings mentioned here. Something's got to give sooner or later.