
Just when it looked like the market fell over the edge of the cliff on Monday, the bulls found a last-minute foothold… and made the most of the move. By the time all was said and done on Friday, the S&P 500’s full-week gain of nearly 2.5% pushed it back above all of its important key moving average lines. The NASDAQ Composite achieved a similar feat.
And yet, neither index cleared every last hurdle in front of it.
Don’t misread the message. There is room to keep running higher from here, and the current momentum is certainly bullish. As such, we are too. We just need to acknowledge all the risks that still await.
We’ll dissect it all in a moment. First, let’s look at last week’s wave of economic reports and then preview what’s coming this week.
Economic Data Analysis
Starting with the bigger picture first, the bulk of last week’s data leaned in a firmly bullish direction. Granted, the firm economy is also spurring just a bit of inflation growth. The overall inflation rate ticked a little higher to 2.9%, while producer inflation continued its trek to higher to a two-year peak. (Core inflation rates, meanwhile, edged a bit lower.)
Consumer, Producer Inflation Rate Charts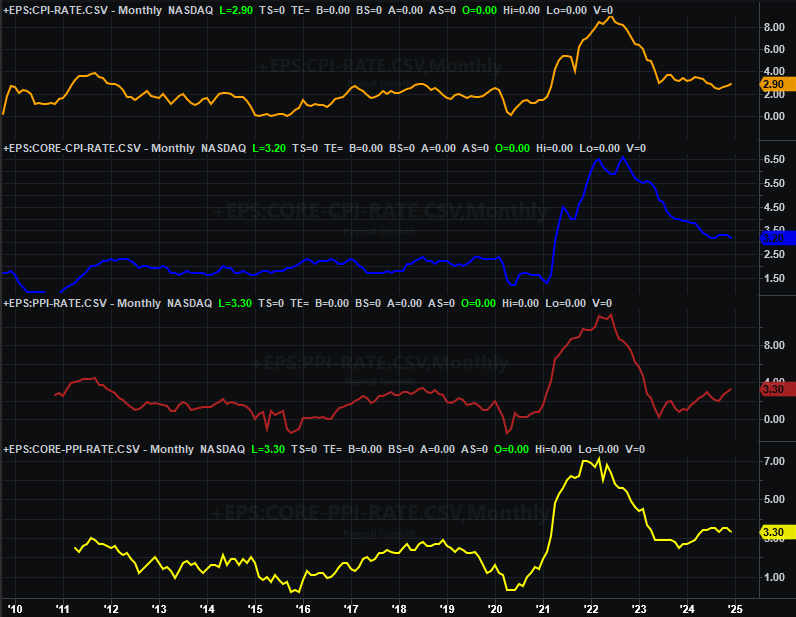
Source: Bureau of Labor Statistics, TradeStation
Although still modest, this persistent inflation is now expected to at least partially curtail the Federal Reserve’s plans to gradually lower rates over the course of the next couple of years.
Underscoring support for modest price increases is continued growth of the nation’s consumerism. All stratifications of the country’s retail sales ticked a little higher again in December.
Retail Sales Charts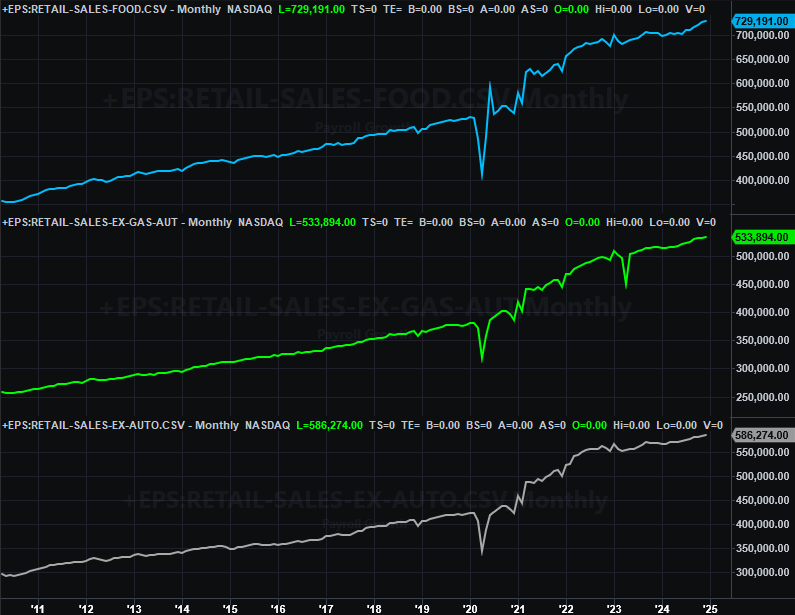
Source: Census Bureau, TradeStation
And we’re seeing at least a little bit of this spending strength trickle into the housing market. Although last month’s permits fell just a bit to a pace of 1.48 million, starts shot higher — and far higher than expected — to a multi-month high clip of nearly 1.5 million. It’s just not clear if this was rooted in a rush to get new builds started before things (like interest rates) change.
Housing Starts and Building Permits Charts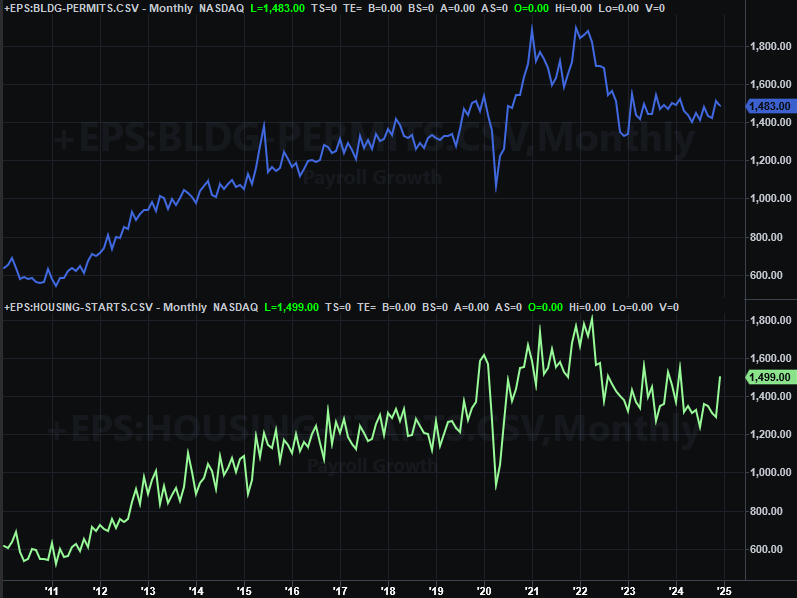
Source: Census Bureau, TradeStation
Finally, on Friday we heard from the Federal Reserve about December’s industrial activity and output. Both capacity utilization and industrial production made clear forward progress. It’s not a game-changing improvement, but all big trends start out as small ones. Given the overall economic tailwind now in place, these moves could very easily mark the beginning of two prolonged uptrends for both data sets.
Capacity Utilization and Industrial Production Output Charts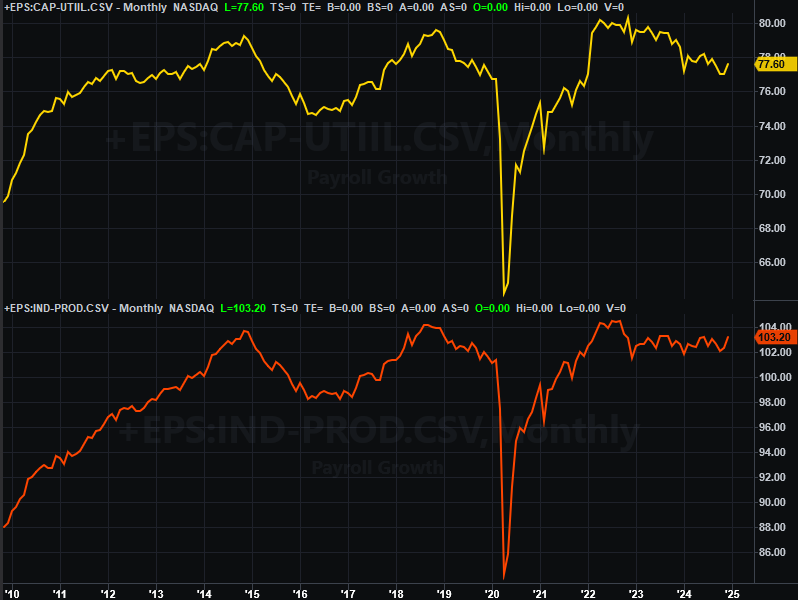
Source: Federal Reserve, TradeStation
Everything else is on the grid.
Economic Data Report Calendar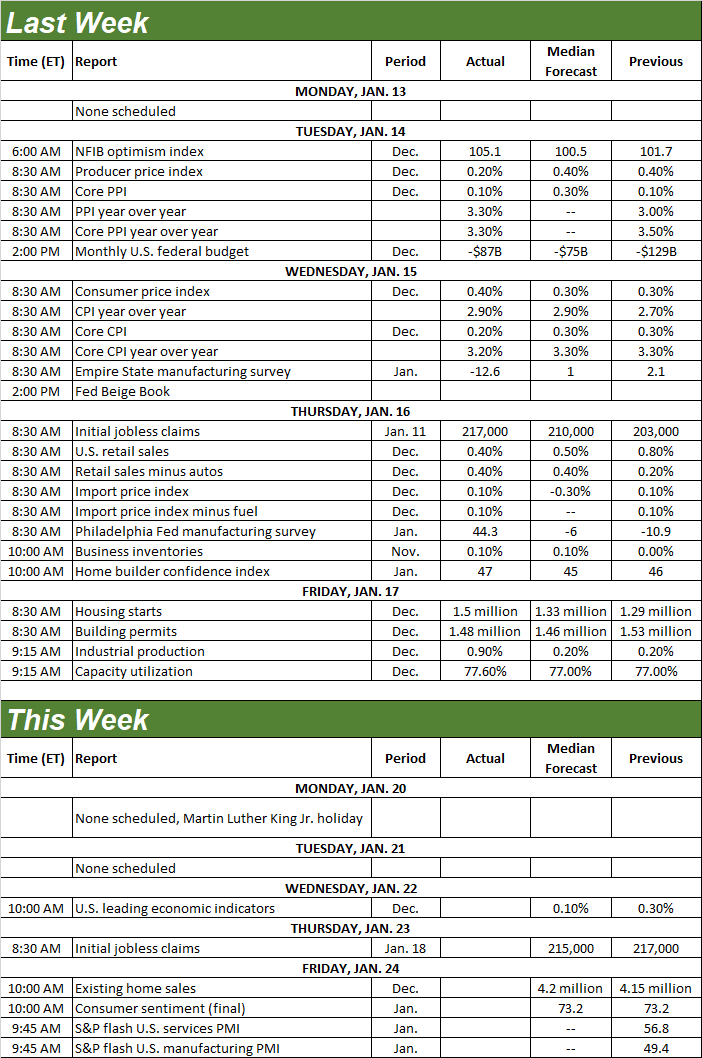
Source: Briefing.com, TradeStation
This week’s going to be particularly light, with everything of interest not surfacing until Friday. We’ll hear the University of Michigan’s consumer sentiment figure then, although economists don’t anticipate much change from December’s final reading of 74.0.
Consumer Sentiment Charts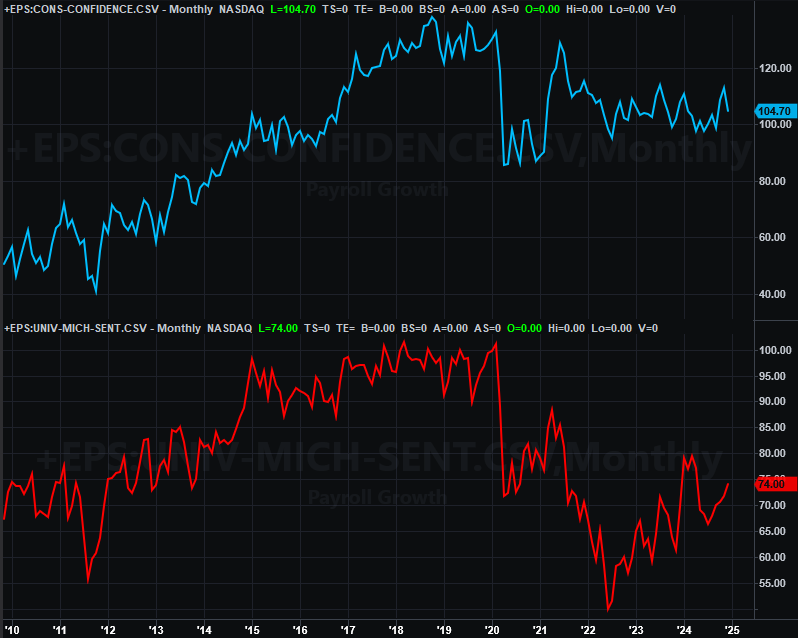
Source: Conference Board, University of Michigan, TradeStation
The Conference Board’s consumer confidence number will be posted next week, rounding out this picture.
Also on Friday look for last month’s existing home sales figure from the National Association of Realtors. It’s expected to edge a little higher, but only a little. Still, we may finally be seeing some slow, shallow progress here… even if it’s a bit intermittent.
Home Sales Charts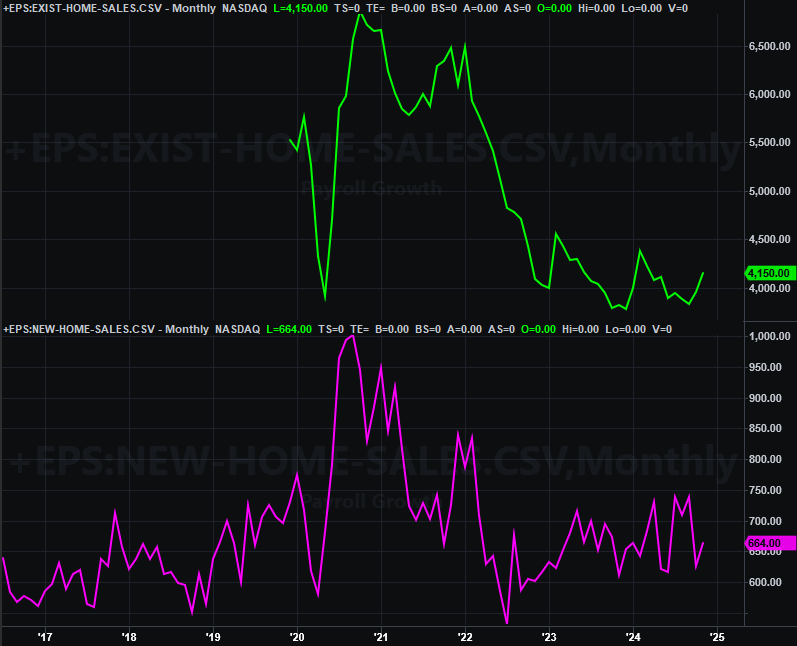
Source: Census Bureau, National Assn. of Realtors, TradeStation
December’s sales of new homes will also be reported next week.
Stock Market Index Analysis
We kick off this week’s analysis with a look at the weekly chart of the S&P 500 simply because we need to paint the bigger picture with some broad brushstrokes first before getting into the finer details. Take a look. Despite the bearish start (and maybe because of it?), the bulls spent the rest of the week in buying mode, reversing five weeks of slow-but-steady selling.
S&P 500 Weekly Chart, with VXN and MACD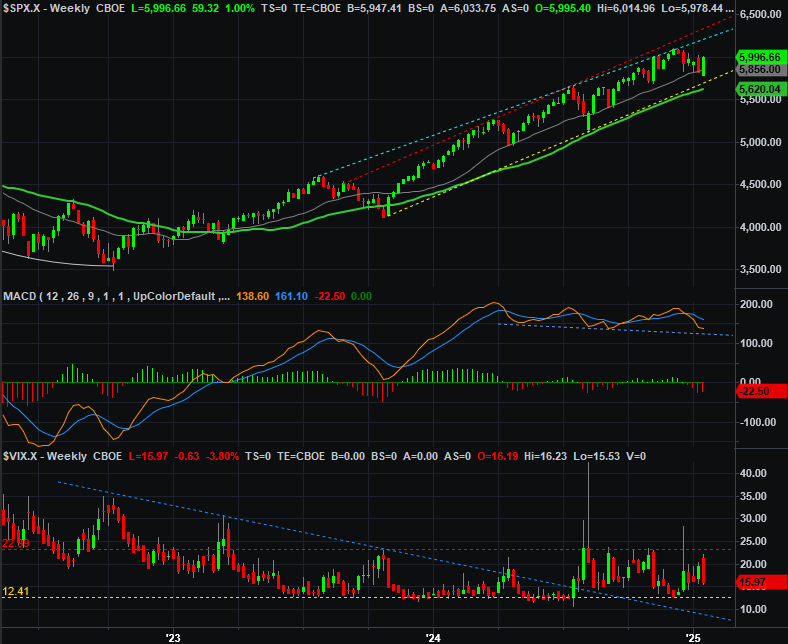
Source: TradeNavigator
Even with the 2.5% move higher, it’s a bit too soon to say a new, longer-lived rally has begun. The reversal took shape near — but not at — a technical floor (yellow, dashed), while the VIX reversed near — but not at — a technical ceiling around 23 (red, dashed). However, it would have been better for the S&P 500 as well as the VIX to each actually reach those extremes before reversing course. As it stands right now, the market is in no-man’s land without any super-strong evidence that there’s momentum truly moving in any particular direction.
The NASDAQ Composite did something similar (although not identical), gaining 2.8% last week. And much like the S&P 500’s volatility index, the NASDAQ’s volatility index (VXN) peaked at a proven technical ceiling when the composite itself hit bottom. Unlike the S&P 500, however, the NASDAQ started this reversal rally nowhere near the lower boundary of its long-term bullish channel. In fact, it’s back to being very close to the upper boundary of this trading range.
NASDAQ Composite Weekly Chart, with VXN and MACD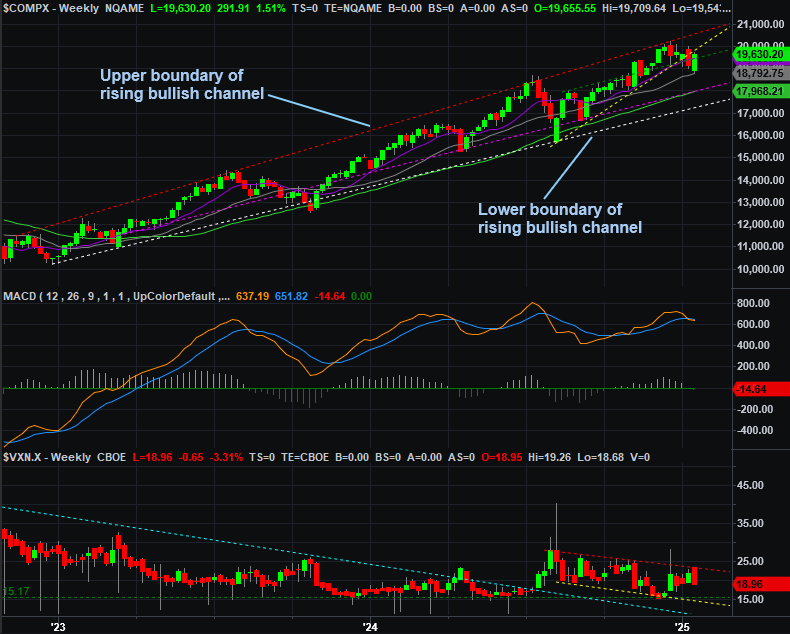
Source: TradeNavigator
Now take a look at the daily chart of the S&P 500… if for no other reason than to prove that the market’s got a funny knack for doing things it arguably shouldn’t. Namely, the index shouldn’t have broken under a recent technical floor at 5,827 without starting a selling avalanche, yet that’s exactly what happened.
S&P 500 Daily Chart, with VIX and Volume
Source: TradeNavigator
Still, the rally did clearly stop an established technical ceiling around 6,021 (orange, dashed). Although there’s plenty of room to keep running higher from where it is now to the upper boundary of its rising trading range (roughly 6,250 right now), there’s certainly no certainty it’s going to get over this first hump.
S&P 500 Daily Chart, with VIX and Volume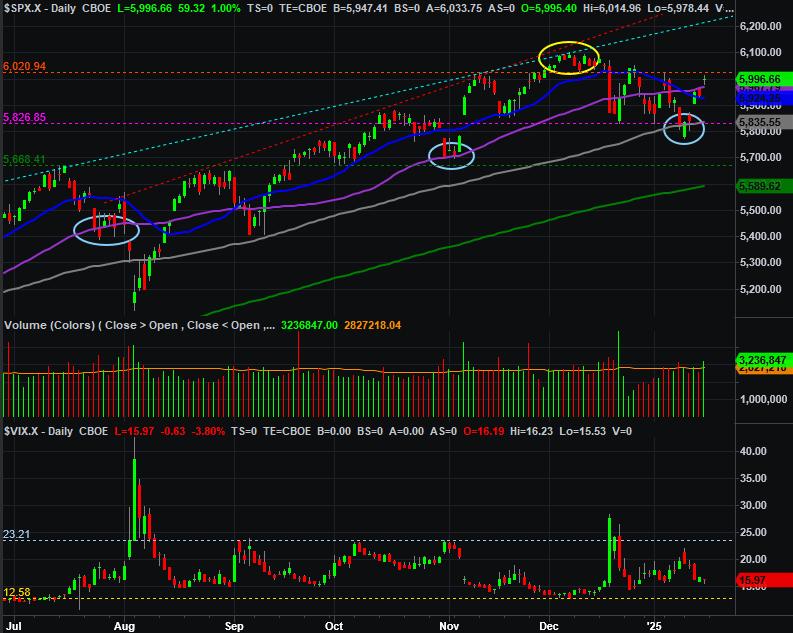
Source: TradeNavigator
The NASDAQ’s daily chart tells the same basic story. That is, it broke below a semi-important floor at 19,140, but rather than sparking a steeper selloff, the composite immediately reversed course. The NASDAQ Composite, however, didn’t actually move back above the now-falling technical ceiling that connects all the key highs going back to its mid-December peak (red, dashed). In other words, the index hasn’t passed any real tests just yet.
NASDAQ Composite Daily Chart, with VXN and Volume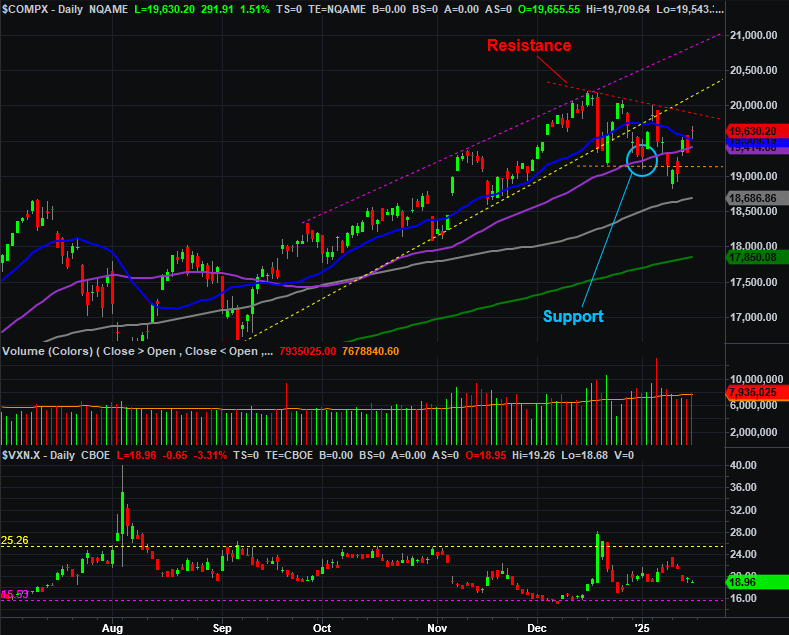
Source: TradeNavigator
So what’s the call? As it stands right now, we’re still not convinced stocks are back in a new uptrend that’s going to last. Last week’s action was almost a little too bullish, yet doesn’t seem to have a ton of support behind it. Both key indexes are also still below their most important technical ceilings. Never even mind the fact that the market is still just well overdue for a true, full-blown correction that could actually hit the bull market’s reset button.
Conversely, only a move back under recent support levels (19,130 for the NASDAQ and 5,827 for the S&P 500) will flag bearishness. Note that such a move would pull the composite’s 20-day moving average line (blue) under its 50-day line (purple) for the first time since September.