
The romp continues. Though stocks started last week out on the wrong foot, a handful of great earnings reports released on Friday prodded the S&P 500 to a record high and a record close. The market has now logged seven consecutive weekly gains, and is now up 23.7% since last year's pre-election low.
 [1]The same concerns still apply, of course. Valuations are stretched thin, and the bulk of the recent buying has been predicated on a tax code overhaul that may or may not happen. It's also just plain overbought. Betting on a pullback, however, has been bad for your portfolio's health for quite some time.
We'll explore the short-term and long-term possibilities below, as always, after a recap of last week's big economic news and previewing this week's announcements.
Economic Data
There wasn't a whole lot of economic news last week worth dissecting, but we did round out the real estate picture we started to draw a week earlier. New home sales surged to a pace of 667,000, trouncing estimates of only 555,000. And, the FHFA Housing Price Index for August was up 0.7% versus July's 0.4% improvement.
Note the surge in new-home purchases sopped up the growing levels of inventory in that segment of the real estate market. It looks like the recent volatility in home sales is leveling out, getting back into the healthy but not overheated advance that's been in place since 2012.
New and Existing Home Sales Charts
 [2]
[2]
Source: Thomson Reuters Eikon
Perhaps just as telling — and encouraging — is the continued rise in home prices; there's still more demand relative to supply.
FHFA and Case-Shiller Home Price Charts
 [3]
[3]
Source: Thomson Reuters Eikon
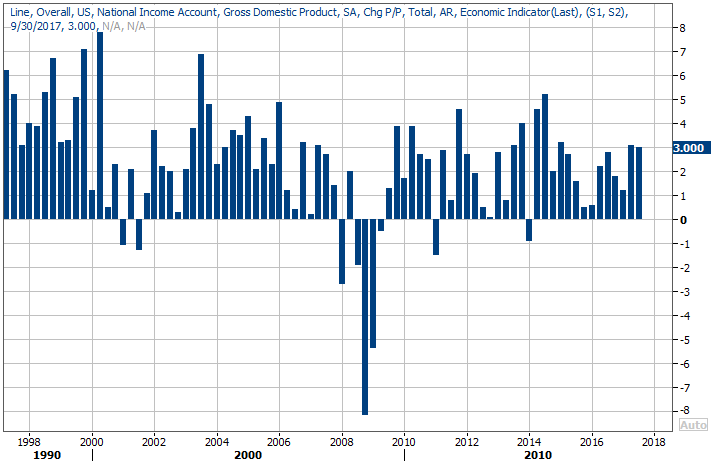
The other biggie from last week, of course, was the first reading (of three) on Q3's GDP growth rate. The pace of 3.0% was well above estimates of 2.4%, and close to Q2's final reading of 3.1%.
It's also a rate that's been largely doubted as unsustainable, but that may be an unwarranted pessimism. Nothing fuels growth like growth itself, and once these growth rates start to rise in earnest they tend to linger at higher levels for some time.
GDP Growth Charts
 [4]
[4]
Source: Thomson Reuters Eikon
Everything else is on the grid.
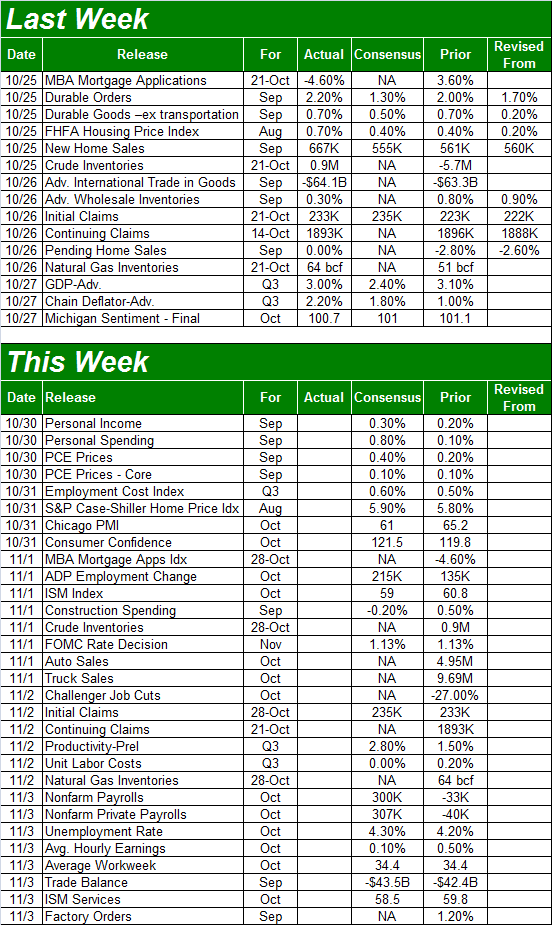
Economic Calendar
 [5]
[5]
Source: Briefing.com
This week is going to be much busier, ending with the grand finale of October's employment report. That consumer-health party starts on Monday, however, with September's personal income and personal spending report. Both are projected to be much higher than August's levels, which is a crucial sign of a strengthening jobs market. Most everyone who wants a job has one, so net payroll growth is tough to muster. Where the progress will be made is in higher paychecks.
We'll also get the rest of the real estate picture with Tuesday's unveiling of the Case-Shiller home price index; look for a 5.9% year-over-year improvement.
On Wednesday we'll hear how the Federal Reserve feels about interest rates; the FOMC will have a chance to raise the Fed Funds Rate then. The pros don't look for a change then, though December is increasingly expected to see one. Traders are saying there's a 98% chance of a quarter-point hike that month.
Wednesday will also offer up October's car sales figures. Again, take them with a grain of salt. A couple of hurricanes have skewed the results, for better and worse, and will continue to do so.
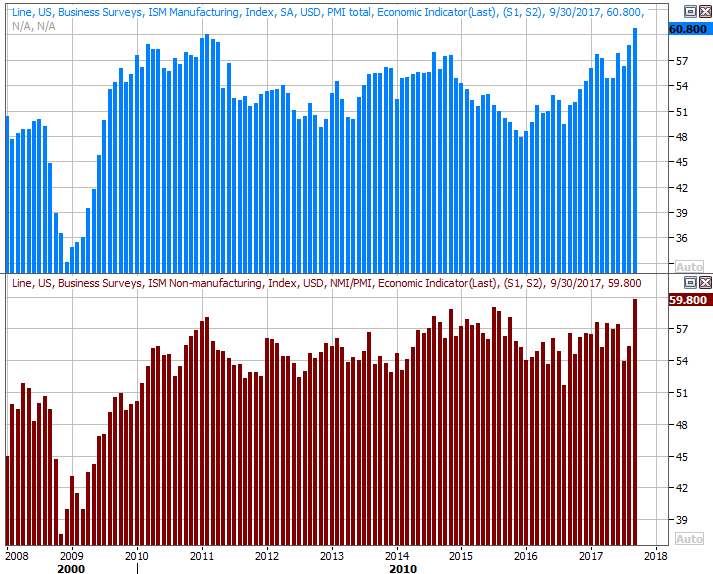
Look for the ISM Manufacturing Index report on Wednesday as well, followed by the ISM Services Index report on Friday. Each is expected to slide a little lower from September's levels, but only just a bit. Both are still well above the key 50 level.
ISM Index Charts
 [6]
[6]
Source: Thomson Reuters Eikon
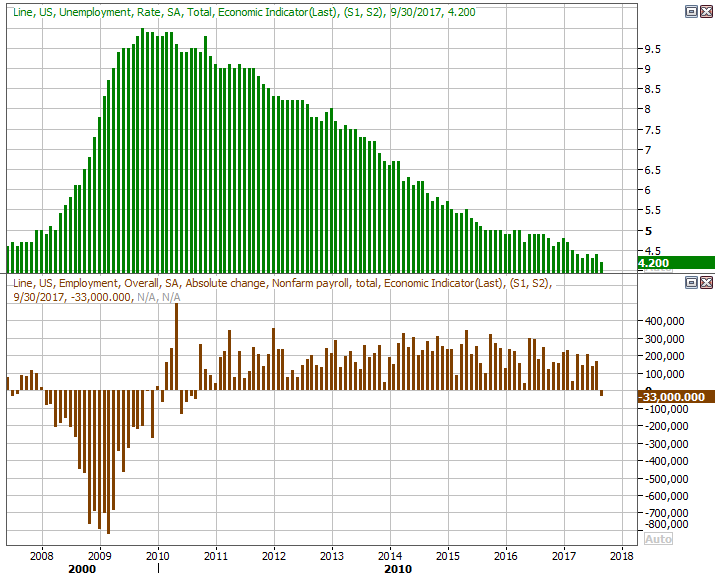
Also on Friday, of course, is September's jobs report. Again, it's going to be tough to add jobs, becuase most people have one. The progress will be in the form of wage growth and increasing participation in the labor force. The pros say the unemployment rate will tick higher from 4.2% to 4.3% despite the creation of 300,000 new jobs. The bar is set low though, as we lost 33,000 payrolls — temporarily — due to hurricanes in September.
Payroll Growth and Unemployment Rate Charts
 [7]
[7]
Source: Thomson Reuters Eikon
Check the website on Friday for the detailed analysis of September's jobs report. We'll be exploring the data you're not getting anywhere else.
Index Analysis
A week ago we described the market's gain as investors going "all in," meaning they were putting in whatever money they still had on the sidelines, certain stocks were going higher in the immediate future.
Last week's gain was tantamount to doubling down on the bet. Though in casino gambling there is no doubling down after an all-in bet, when it comes to stocks, the idea still applies. That is to say, it almost feels as if those bulls are trying to convince everyone else — and maybe even themselves — they made the right call. Last week's bullish volume was the most weekly volume we've seen since June.
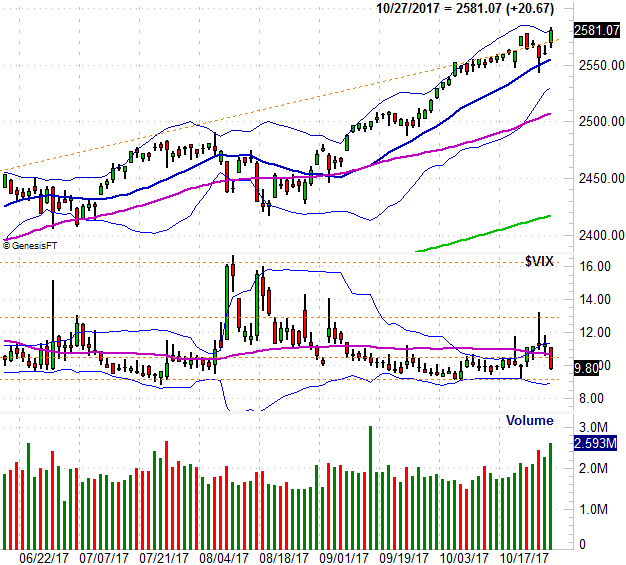
The daily chart of the S&P 500 below is what it is. The ceiling (orange, dashed) that has been holding the market back was busted a week ago, and then re-busted last week after the index kissed the 20-day moving average line (blue). Superficially speaking, this points to bullishness ahead.
S&P 500 Daily Chart
 [8]
[8]
Source: TradeNavigator
The bulls meant it, or at least think they meant it. The VIX plunged on Friday, and though a low and/or falling VIX often means a pullback is often in the near-term cards (confidence peaks at market tops), a low VIX hasn't been a long-term problem for the market in a long, long time.
It's a dilemma, to be sure. Stocks are technically overbought and fundamentally overvalued, but fight the tape at your own peril. If traders don't care about the risks enough to price them in, then don't become a martyr to make a point.
The weekly chart of the S&P 500 doesn't tell us much more about the matter, but it does put things in perspective. Up nearly 24% since this time last year — with not even a minor correction between here and there — this is an unusual situation.
S&P 500 Weekly Chart
 [9]
[9]
Source: TradeNavigator
Though what's coming down the near-term pike is very unclear, after last week's high volume surge, one caution has to be offered… don't confuse a blowoff top with a new breakout. From here (after last week's bullish acceleration), the former is more likely than the latter. That is to say, the rally would last a lot longer if it moved at a slower pace. If the market continues to race higher or even pick up speed, that may drive a climax leaving stock no choice but to kick-start a massive wave of profit-taking.
At the same time, continue to keep an eye on the 100-day moving average line (gray) as the make-or-break support level for the S&P 500. If the index falls under that level for the first time since November of last year, that too could set a sizeable corrective move into motion.
This remains a day-to-day affair… even more so than usual.