
Another week, another win. All the indexes trekked deeper into record-high territory, seemingly with plenty of momentum behind the move. And, maybe there is indeed lots of momentum at work here. There’s good reason to be cautious though. The market was already dangerously overextended. Last week, the rally effort was suspiciously stopped right at a couple of different established technical ceilings.
And that’s not the only worry here.
We’ll loot that rally’s unlikely continuation in a moment. First, let’s review last week’s biggest economic news and preview what’s in the cards this week.
Economic Data Analysis
Not a lot of anything of great interest reported last week, but we did get a couple of biggies.
The first of these is Monday’s look at last month’s manufacturing barometer from the Institute of Supply Management, followed by the services index update on Wednesday. The former improved a little, but still remains below the key 50 level. The latter is still above the 50 mark, but also fell in November. In both cases last month’s move reverse previous trends, wrecking any hope for reliably determining — at least based on this data — how well the economy’s doing.
ISM Services, Manufacturing Index Charts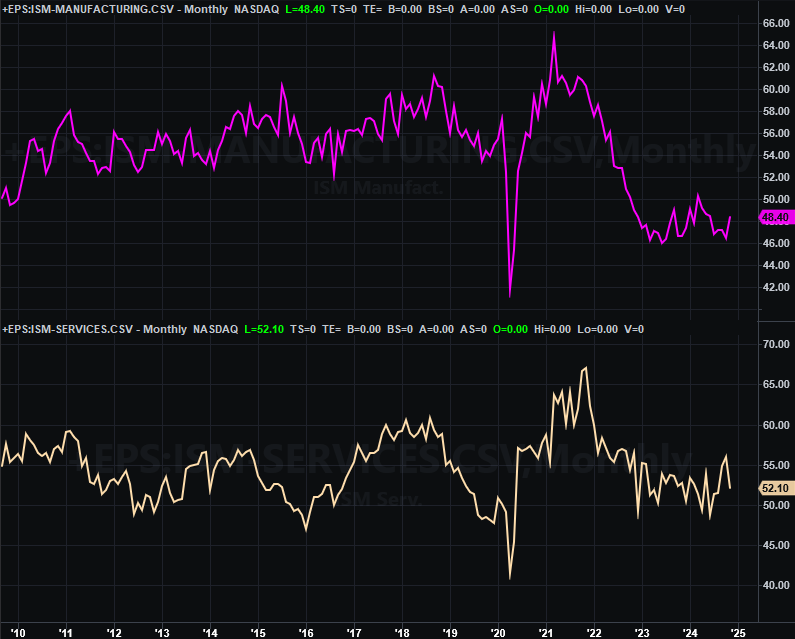
Source: Institute of Supply Management, TradeStation
Still, in a bigger-picture sense, it feels like both ISM numbers are at least trying to start a prolonged move higher. That’s a little bullish.
The other data set from last week is just as vexing. That’s November’s jobs report. Although payroll growth recovered even more than expected from October’s deep lull, payroll growth of 227,000 net new jobs wasn’t enough to prevent the unemployment rate from edging back up from 4.1% to 4.2%. That’s still a respectable level, broadly speaking, although there’s no denying the jobs picture is weakening.
Payroll Growth, Unemployment Charts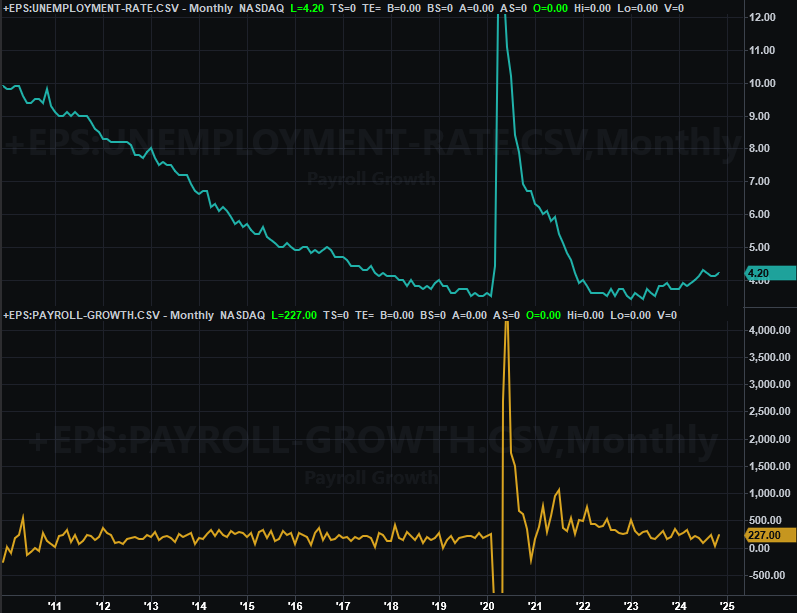
Source: Department of Labor, TradeStation
Everything else is on the grid.
Economic Calendar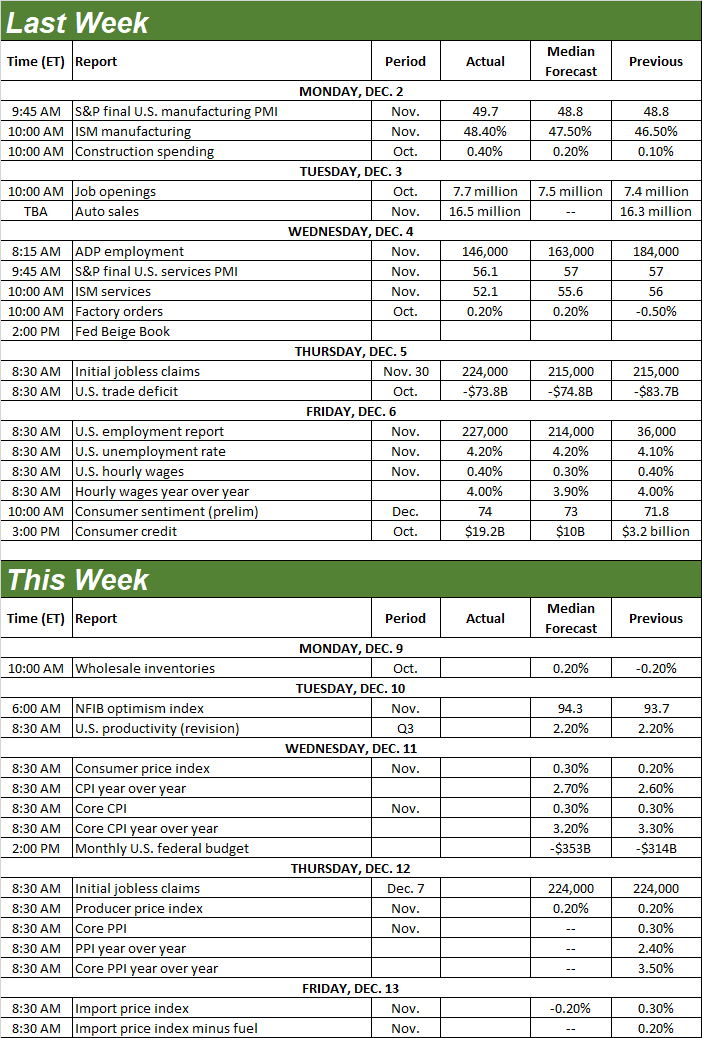
Source: Briefing.com
The only economic information of interest coming this week is Wednesday’s look at consumer inflation, and Thursday’s look at producer inflation. Both have been stabilizing near nominal target levels for several months now, and should hold at these recent levels once more.
Consumer, Producer Inflation Charts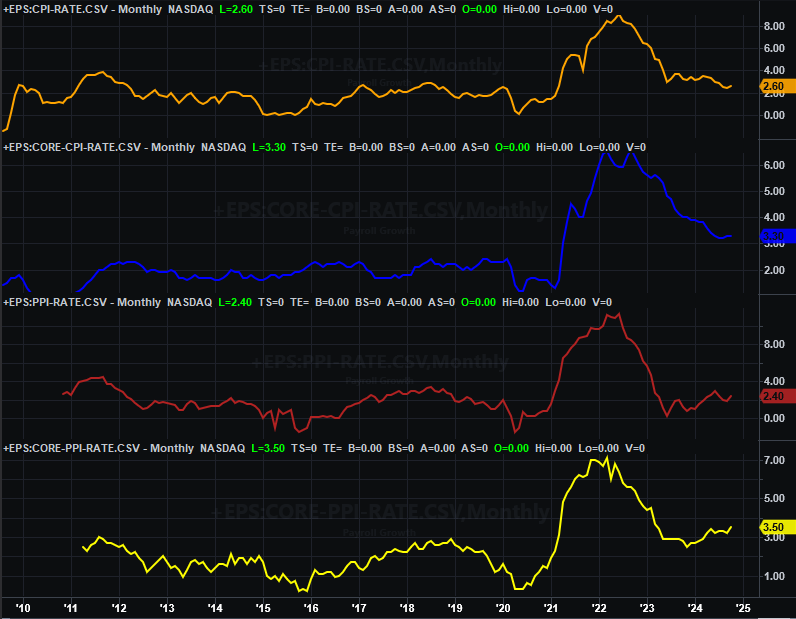
Source: Bureau of Labor Statistics, TradeStation
As for what this means for interest rates, not a lot in and of itself. Modest, steady levels of inflation, however, does mean the Fed doesn’t have to feel pressured into action one way or another. Either way, look for slow, measured rate cuts over the course of the next two years… as has been the plan for some time now.
Stock Market Index Analysis
In last week’s analysis we pointed out how the indexes were pushing up and off of their 20-day moving average lines, but within the confines of converging wedge patterns. Both nuances become even more important factors last week. Take a look at the daily chart of the NASDAQ Composite below to see this. Using the 20-day line (blue) as well as the lower boundary of the rising wedge pattern (yellow, dashed) as a springboard, the composite managed to advance right up to what’s been confirmed as the upper boundary of a converging wedge (purple, dashed). But, it didn’t go one inch farther.
NASDAQ Composite Daily Chart, with VXN and Volume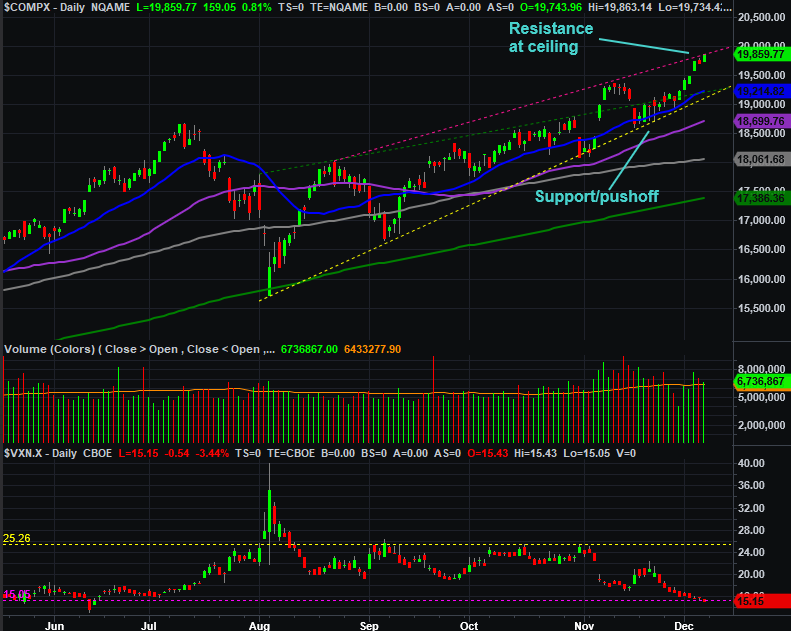
Source: TradeNavigator
Also notice the NASDAQ’s volatility index (VXN) is now all the way back to a major technical floor. Although it’s possible for the composite to continue rallying while the volatility index is this low — it can simply drift sideways — it’s difficult for it to do so.
There is room for the NASDAQ to do this, though, on the weekly chart. Take a look. There’s roughly 800 points of space between where the composite is now and where the technical ceiling connecting all of the key highs going back to late-2022 (red, dashed) currently stands. This weekly chart, of course, also verifies that the volatility index is back at an absolute low…although as you can also see, for the better part of this year the VXN has lingered at this level while the NASDAQ has logged then-seemingly-unlikely gains.
NASDAQ Composite Weekly Chart, with VIX and MACD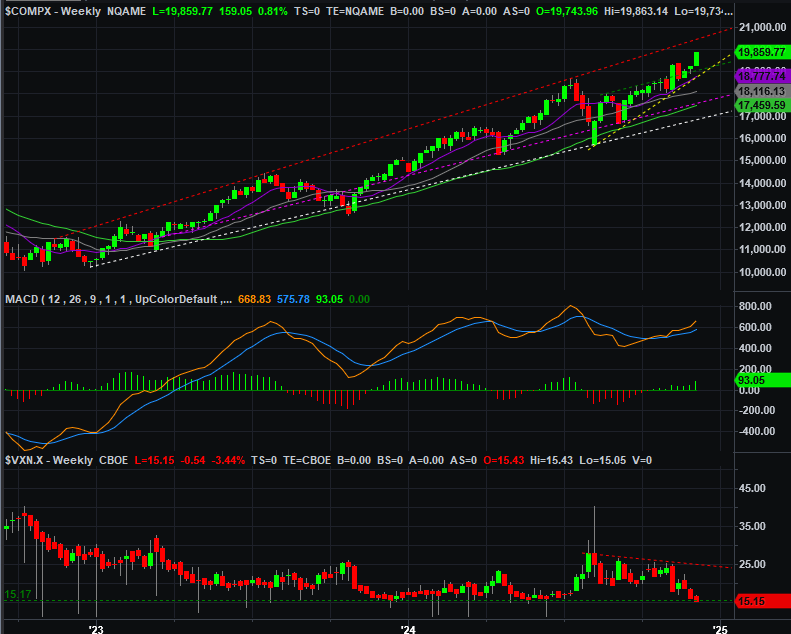
Source: TradeNavigator
The S&P 500’s current story is nearly identical. Take a look at its weekly chart below. As of last week the index is testing the technical ceiling that connects several key peaks going back to the early part of last year (light blue, dashed). Even if the bull market is still alive and well, the S&P 500 is clearly at the upper boundary of its long-term bullish channel (the space between rising support and resistance lines). And, as the was the case with the NASDAQ, the S&P 500’s Volatility Index (VIX) is back at low levels often seen when the S&P 500 itself starts facing tougher headwinds… headwinds that often lead into outright market corrections.
S&P 500 Weekly Chart, with VIX and MACD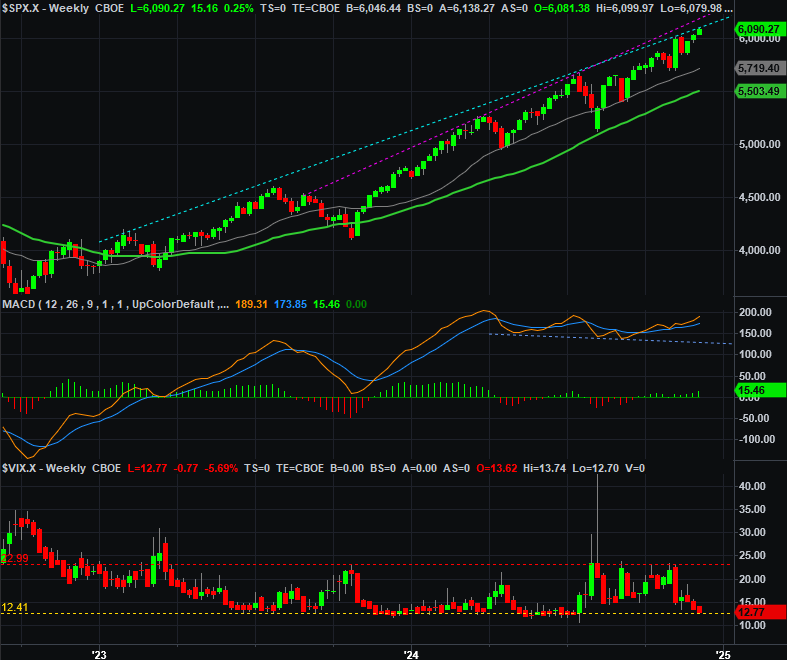
Source: TradeNavigator
Here’s the zoomed-in daily chart of the S&P 500, which highlights the fact that the index is now bumping into not just one but two different technical ceilings. There’s the longer-term one that goes back for nearly two years, but there’s another resistance line (red, dashed) that connects all the highs just since late July.
S&P 500 Daily Chart, with VIX and Volume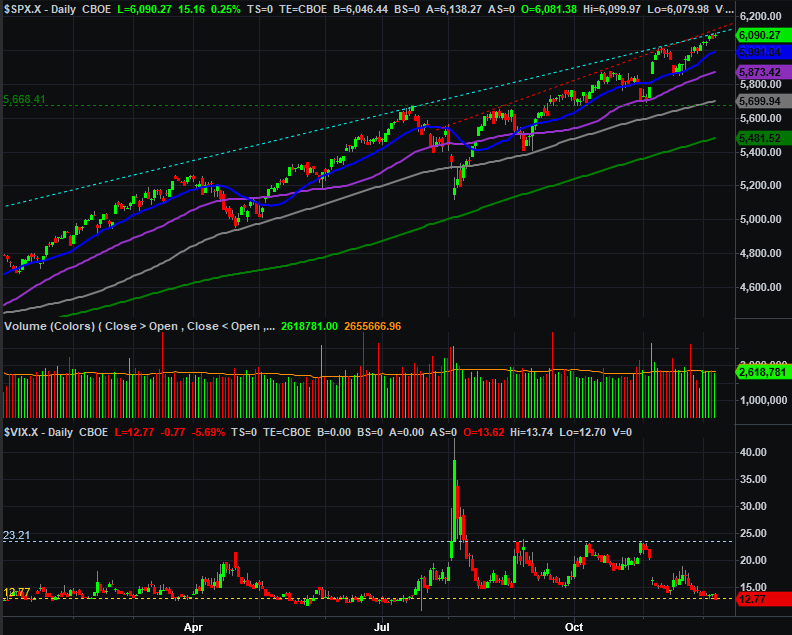
Source: TradeNavigator
Never say never, but for the index to keep moving higher from here without a sizeable setback being suffered first, it would need to do something that would be pretty amazing. The S&P 500 is now up 19% since its early-August low, which is actually an unusually-big move for the timeframe.
So what’s the call? We’re first and foremost momentum traders, so we have to lean in a bullish direction until we clearly have a reason not to. The risk of an immediate and sizeable pullback from here is also well above average though, which we can’t afford to ignore. It’s coming, sooner or later, and probably sooner than later. Even once we start seeing a pullback though, know that there’s still a ton of technical support not that far below that could bring a quick end to any selling… even if we need a bigger selloff.
The wrench in the works is the time of year; the market’s generally bullish throughout December. There’s just not a whole lot of room for more gains from here, however, making things nearly impossible to confidently handicap.