 [1]Another week, another drubbing. Last week's big stumble from the S&P 500 rekindled a wave of selling that got going in a big way three weeks ago, but paused two weeks ago. But, now down nearly 10% from its peak hit in early October, one can't help but wonder of the sheer speed and scope of the beat-down has left stocks ready to bounce. There are several things about Friday's action that suggest this could indeed be the case.
We'll take that detailed look at the market below, as always. First though, let's run through last week's economic reports and preview this week's economic news.
Economic Data
Not a lot of economic news for last week, which might be for the best anyway. Between a wave of earnings reports, a major market meltdown and plenty of political drama, most of it would have gone unnoticed anyway. It's worth a look-back either way.
Following the existing-home sales report from two weeks back, last week we got a tally of September's new-home sales pace. Not surprisingly, though slowed too, further gelling a slowdown in the over real estate market.
New and Existing Home Sales (Annualized) Charts
 [2]
[2]
Source: Thomson Reuters
So far that slowdown has been contained to just real estate, and hasn't infected other parts of the economy. Nevertheless, a rebound on this front would be welcomed with open arms.
It's possible the issue really is one of affordability.
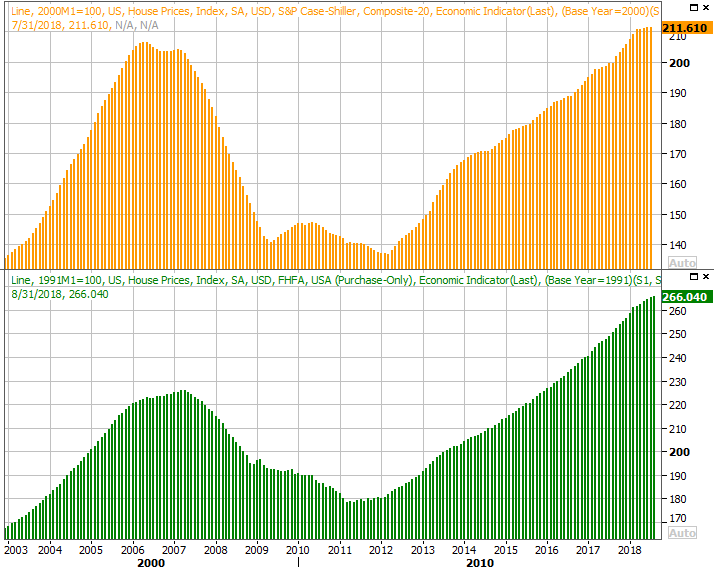
It's not data we look at all that often, only because it's never any newer than two months behind. But, in that we get the FHFA Housing Price Index update last week and will get the Case-Shiller Home Price Index report for August this week, it's worth a look here and now just to make a key point – homes, on average, cost more now than they did at the height of the real estate craze in 2007.
Home Price Index Charts
 [3]
[3]
Source: Thomson Reuters
Given how out of control things were then – when nobody cared or thought twice about it – and given how cautious consumers have been this time around, this is telling. And, it's not like we can chalk all of it up to inflation.
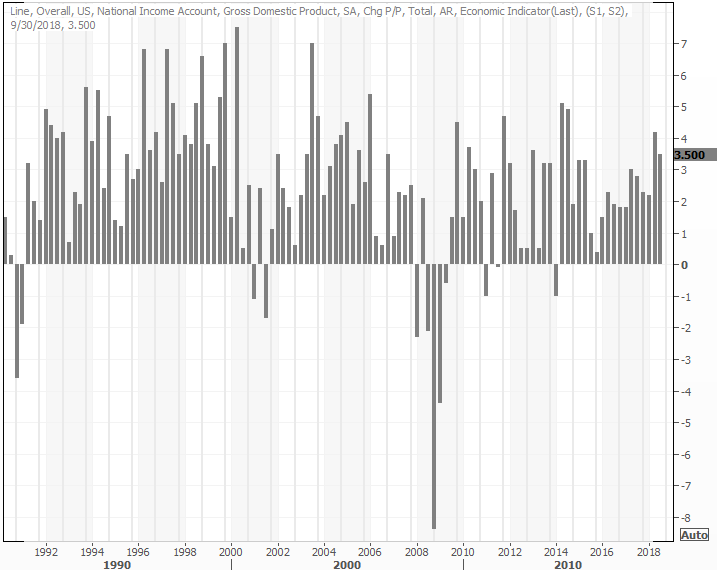
The only other item of interest from last week was the first look (of three) at Q3's GDP growth rate. Economists were calling for a pace of 3.3%, but the initial calculations say it's closer to 3.5%.
GDP Growth Rate (Annualized) Charts
 [4]
[4]
Source: Thomson Reuters
That's good, though some observers are concerned that it will keep the Federal Reserve in full rate-hike mode (not that it wasn't already in that mode in the first place).
Everything else is on the grid.
Economic Calendar
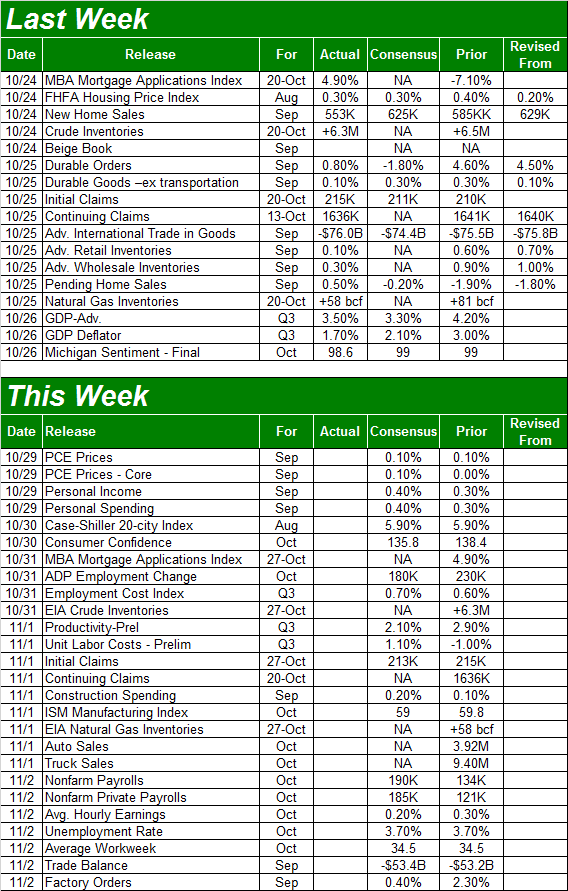 [5]
[5]
Source: Briefing.com
This week is going to be much busier. Though more earnings reports will likely distract most investors (as will the market's potential reversal effort), there are a handful of these items you'll want to keep an eye on… particularly the grand finale, which is October's unemployment report slated for release on Friday.
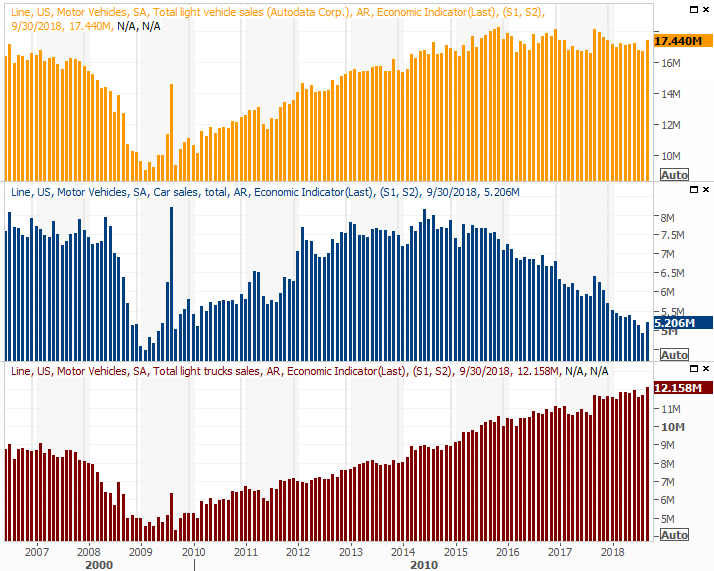
But, first things first. Be sure to check out October's auto sales update, posted on Thursday. They had been trending lower since last year, but popped in September. That may be something of a one-off though, prompted by insured replacements of vehicles lost or destroyed by hurricanes. Another one swept through in the meantime, so October should be a good month that bleeds into November. It remains to be seen, however, if a long-term growth trend can be rekindled.
Auto Sales (Annualized) Charts
 [6]
[6]
Source: Thomson Reuters
As for the jobs report, bet against more progress at your own peril. Though economists don't think the unemployment rate is capable of moving any lower than September's figure of 3.7%, that doesn't mean they're not calling for an additional 200,000 newly-filled positions.
Job Growth and Unemployment Rate Charts
 [7]
[7]
Source: Thomson Reuters
As always, we'll take a deeper look at the whole jobs picture at the website later in the day on Friday.
Index Analysis
By the time Friday's closing bell rang, the S&P 500 was off by 3.9% for the week, rekindling a selloff that many thought had ended by virtue of the prior week's breakeven. The index is now down about 10% from its peak, which is enough to qualify as a 'correction.'
Just qualifying as a correction doesn't inherently mean the market's ready to bounce. But, there are a couple of other big clues that certainly imply a bottom could have been made.
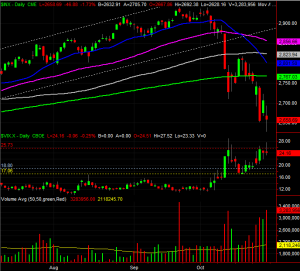
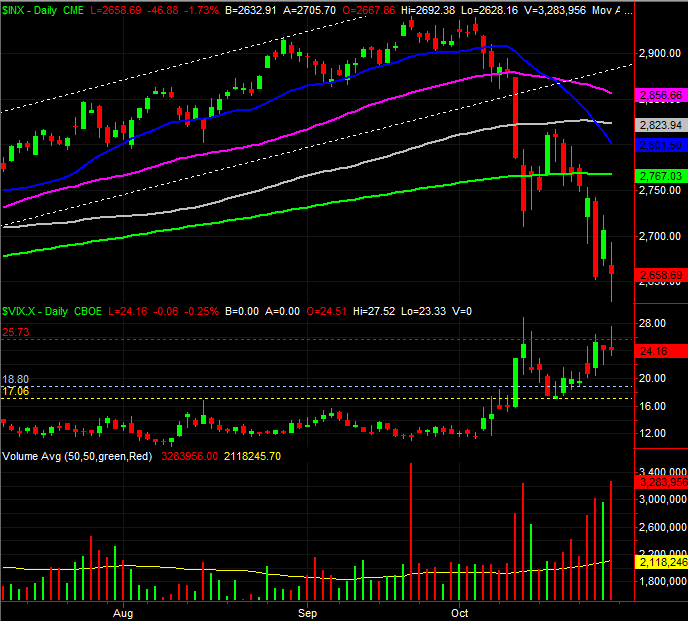
One of them is the shape of Friday's bar. It's a doji, where the open and close are more or less aligned with one another, and more or less in the middle of an unusually wide low-to-high range. This is often an indication that equilibrium between the sellers and buyers has been met, as part of the point where we're transitioning from a net-selling to a net-buying environment. Friday's volume surge suggests the same, with a whole lot of stocks trading hands in a frenzied hurry.
S&P 500 Daily Chart, with Volume
 [8]
[8]
Source: TradeStation
The other big clue that a low may have been made is the fact that the VIX didn't move any higher even though the S&P 500 moved lower. It appears the VIX is unable to break above a major technical ceiling right around 25.0. Traders may have already decided a bottom has been made via the VIX.
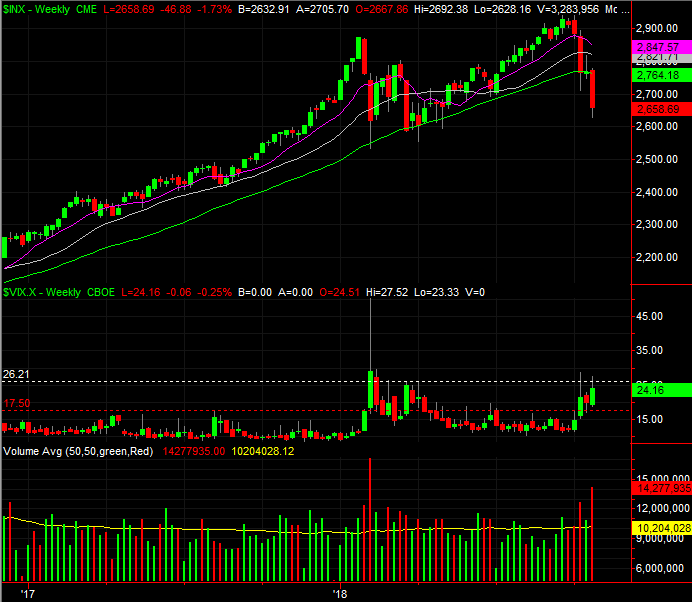
A view of the weekly S&P 500 chart outs things in perspective, particularly for the VIX, but also with the market's setback itself. In terms of size and scope, this stumble looks a whole lot like the one in February… the one that relapsed in March but ultimately led into a pretty nice rally.
S&P 500 Weekly Chart, with Volume
 [9]
[9]
Source: TradeStation
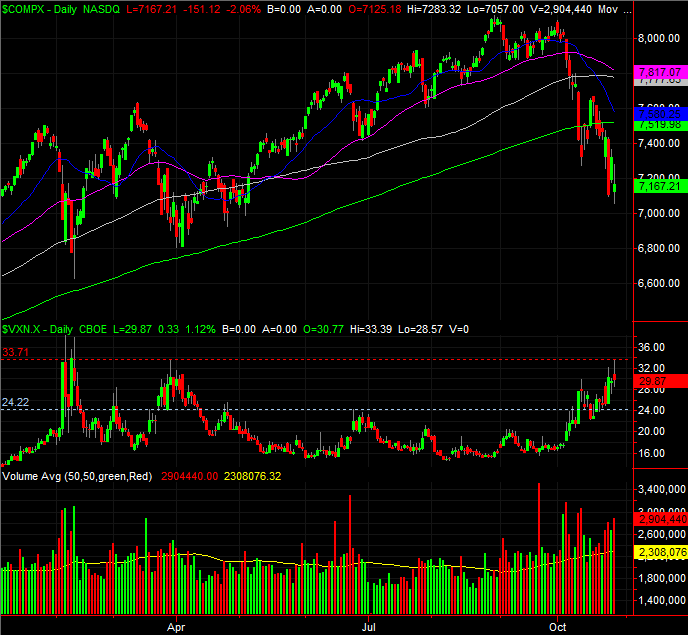
The NASDAQ's chart looks about the same.
NASDAQ Composite Daily Chart, with Volume
 [10]
[10]
Source: TradeStation
Still, don't misunderstand what the current market environment is. This is a market that's been hijacked by sentiment, and can do some stunning things… good and bad. Traders may have set the stage for a reversal on Friday, but the wrong news in the meantime could easily rekindle the downtrend. Stocks are behaving irrationally because traders are thinking less-than-normally.
As such, before plowing into new trades in anticipation of a decisive bounce, don't. Any rebound that can be relied on will at least need confirmation of a firm first move higher. And, investors need to understand that even a move back in the right direction could still be easily up-ended. If we're going to get the usual year-end bullishness, it needs to be set up with a solid foundation. That's more of a process than an event.
We'll talk more about the process if and when it becomes necessary.
The good news is, it should be clear within a week or so if the correction has fully run its course.