It had to happen sometime. Last week was that 'sometime.' That is, after eight straight weekly gains, the market finally logged a loser last week. Then again, it shouldn't be that much of a surprise. The rally had been slowing down for a couple of weeks, and was increasingly overbought.
 [1]It's still not beyond salvaging, mind you — the bullishness could be easily rekindled by progress with tax reform or some sort of new economic clarity from Washington; investors are looking for reasons to be bullish here. On the other hand, stocks are in a rather reliable ebb-and-flow pattern here, and it's time for a bearish ebb.
We'll look at the market's likely undertow below, after examining last week's and this week's economic reports.
Economic Data
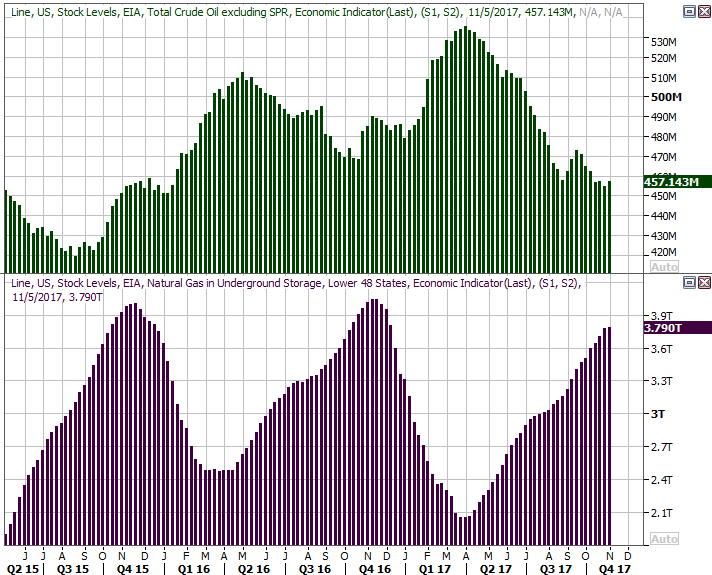
As was noted a week ago, the only real economic news of any interest to us this week was the stockpile levels for crude oil and natural gas. The latter had been edging lower — resuming a bigger-picture downtrend that began months ago — while the latter was moving higher as producers built up inventories headed into the winter season. The buildup of natural gas, however, was still lower than where we'd been at this time in previous years.
Last week's results didn't give us too much drama. Crude oil inventories grew a little bit — a total of 2.2 million barrels — while natural gas levels were up just a hair. Note that this is the time of year natural gas stockpiles tend to level off and them start to fall. What's different is that they're peaking at the lowest levels we've seen in a couple of years.
Crude Oil, Natural Gas Stockpile Charts
 [2]
[2]
Source: Thomson Reuters Eikon
Though crude oil inventories would ideally move lower and already be at lower levels for crude prices to be supported, in the bigger picture, oil bulls have to like the way oil inventories continue to dwindle.
Everything else is on the grid.
Economic Calendar
 [3]
[3]
Source: Briefing.com
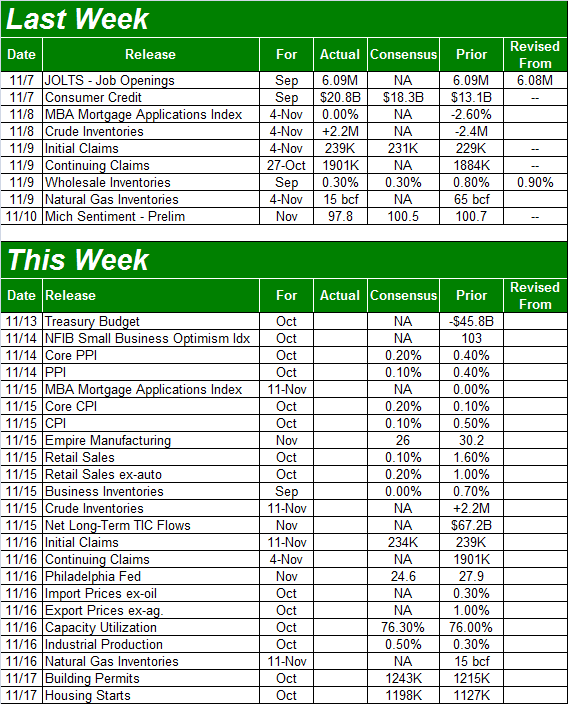
This week will be overwhelmingly busy, making up from lost time with last week's lull.
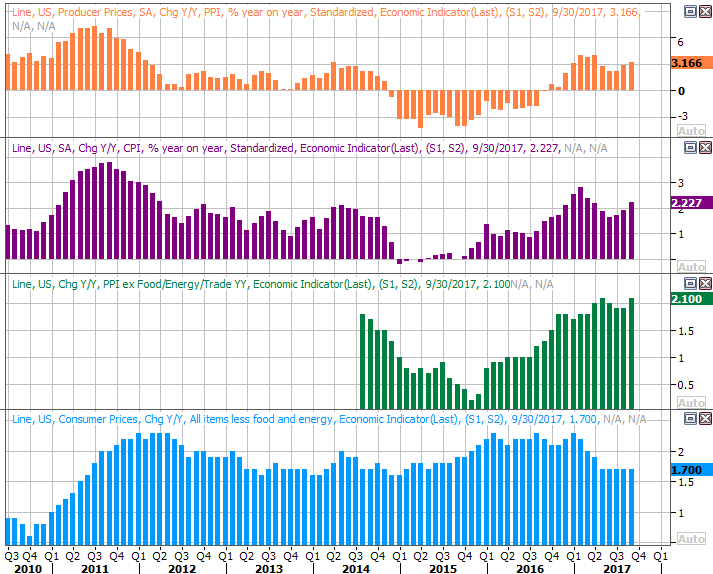
The party starts on Tuesday with October's producer inflation report, though the main event isn't until Wednesday when we'll hear last month's consumer inflation data. Producers' cost growth is projected to edge a little higher, between 0.1% and 0.2%, while consumer prices are expected to rise between 0.2% and 0.3%, depending on which data you're looking at. On an annualized basis, that should keep the inflation 'rate' somewhere around its current level of 2.2%. That's enough to keep the expected December rate-hike on the table.
Inflation Charts
 [4]
[4]
Source: Thomson Reuters Eikon
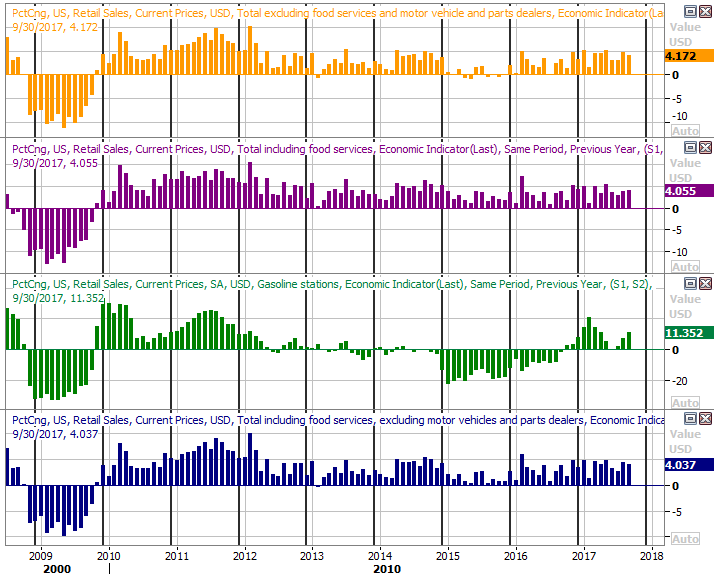
We're also going to get October's retail sales figures on Wednesday. They've been pretty good of late, and the pros are looking for more of the same for last month… up between 0.1% and 0.2% on a month-to-month basis, which means growth of around 4.0% year-over-year.
Retail Spending Growth Charts
 [5]
[5]
Source: Thomson Reuters Eikon
Retail spending is a deal-maker or deal-breaker for this fragile but compelling economic growth environment.
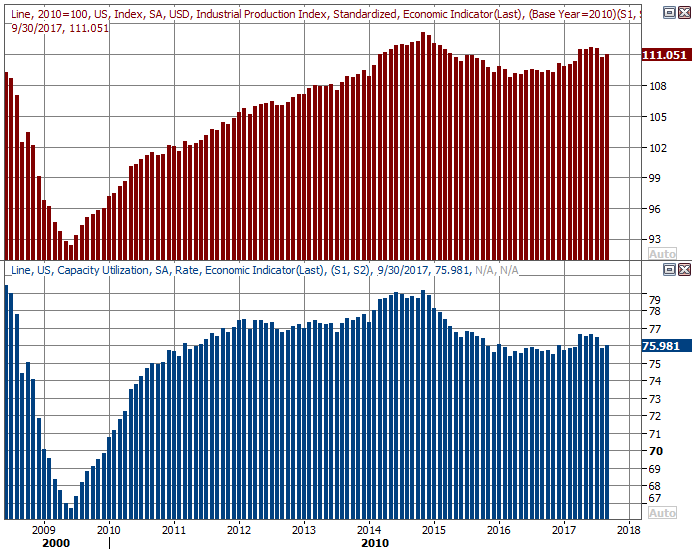
On Thursday we're going to get a very important though often overlooked report — last month's capacity utilization and industrial productivity report. Each has been on the mend around the middle of the year, though both were disrupted in September by a couple of hurricanes. The skew is still likely in effect. Economists aren't looking for much of a change this time around, so a big beat or a big miss could shake things up. Do note the broad improvement we're seeing here on both fronts though.
Capacity Utilization and Industrial Productivity Charts
 [6]
[6]
Source: Thomson Reuters Eikon
Last but not least, prepare for housing starts and building permits on Friday. The hurricanes certainly skewed both of these measures too — for the worse — but you can see they were slowing before September anyway. Home prices are still on the rise, but we've not been selling them at the red-hot pace from yesteryear.
Housing Starts and Building Permits Charts
 [7]
[7]
Source: Thomson Reuters Eikon
Index Analysis
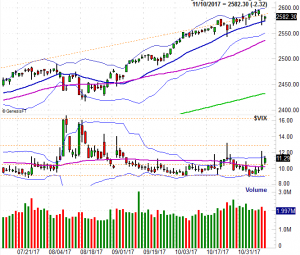
We'll start this week's analysis with a look at the weekly chart of the S&P 500, just to paint a picture with a broad brush stroke. After slowing down over the course of the past few weeks, the bears finally managed to force the trend to pivot. It wasn't a decisive pivot, mind you, but it's at least a toe-hold for the bears. Still, the index has yet to make a lower weekly low, and last week's loss was slight. It's too soon to call this a full-blown pivot point.
S&P 500 Weekly Chart
 [8]
[8]
Source: TradeNavigator
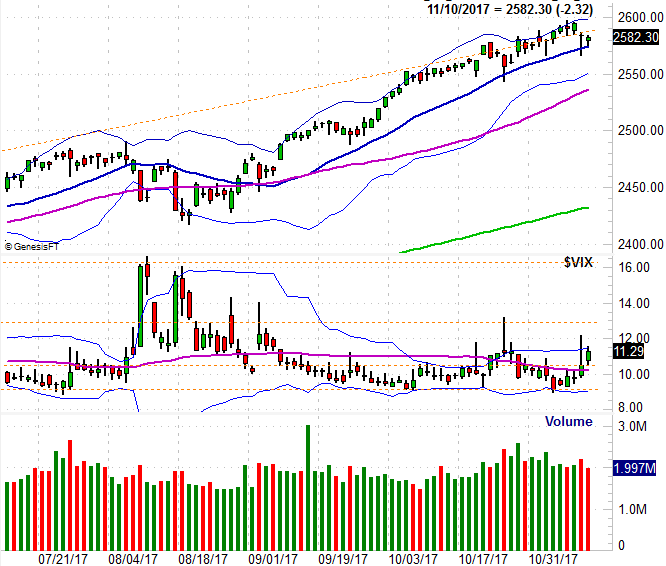
You can also see on the weekly chart the VIX has broken back above a key resistance line… the upper boundary of a long-term wedge that extends back to 2016. Though the VIX's key technical ceiling at 16.4 is still intact, this is a start. The question is, can this turn into a finish?
Maybe, but it's way too soon to assume that's what's in the cards, in light of the daily chart of the S&P 500.
Take a look. Despite Thursday's and Friday's stumble, the 20-day moving average line held up as a support level, even prodding a rebound both of those days. You can also see that while the market was selling off a little late last week, the selling effort wasn't a high volume one.
S&P 500 Daily Chart
 [9]
[9]
Source: TradeNavigator
On the other hand, maybe it was a higher-volume selling effort than it seems.
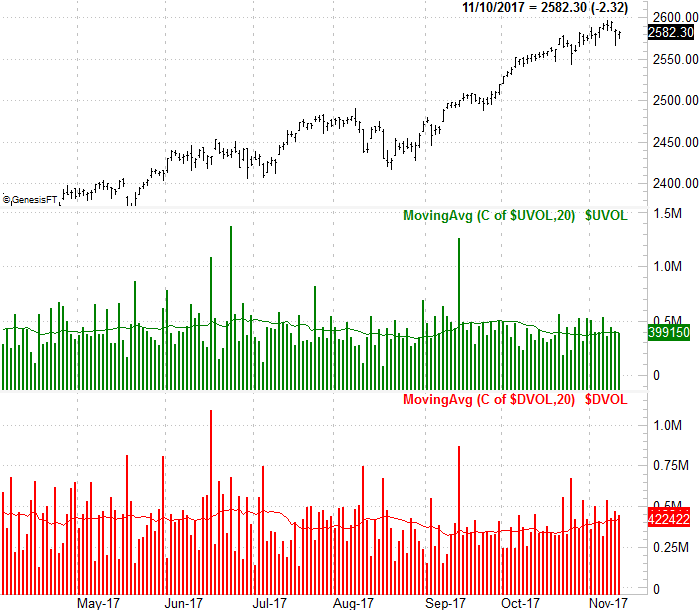
A week ago we took a look at the NYSE's breadth (advancers versus decliners) and depth (up volume versus down volume). We sensed that tide was turning for the worst at the time, and we still have good reason to think that. The graph below tells the tale. The NYSE's bearish volume continues to rise, while its bullish volume is still dwindling.
NYSE Up and Down Volume
 [10]
[10]
Source: TradeNavigator
The NYSE's advancer/decliner ratio is similarly, increasingly alarming.
Also of concern is the changing leadership (or laggardship) among the market's key sectors. Materials, financials, industrials and now even technology stocks are starting to falter, while defensive areas like utilities, services and consumer goods are perking up. It implies traders are making a point of moving out of risky areas and into safe havens, further implying investors have already planned on a pullback. They may make one happen as a result.
Sector Performance Chart, since August 21st
 [11]
[11]
Source: TradeNavigator
Still, until the 20-day moving average line at 2575 fails as a floor, and really until the 50-day moving average line at 2536 is broken as support, we can't really assume a breakdown looms even though we have to respect the likelihood of such a move.