A week ago we cautioned traders that the market was sending mixed messages. While the uptrend since mid-March was still intact, there were hints that a pullback was brewing. We got exactly that last week.
And yet, there's still a vestige of hope from at least one of the key index charts. It's flimsy support though, and one more rough day could still easily drag stocks to levels where there's no nearby floor. And, all the indices are still on the wrong side of their pivotal 200-day moving average lines.
We'll explore the matter in detail below. First, however, let's look at last week's key economic day and preview what's coming this week.
Economic Data Analysis
There was really only one economic item of interest released last week… the Institute of Supply Management's Non-Manufacturing (Services) Index, rounding out the ISM Manufacturing Index update posted the previous week. While its manufacturing measure continued to slide lower from its post-pandemic surge, the services index slightly reversed its fall to climb just a bit last month. March's reading of 58.3 wasn't quite the 58.5 economists were expecting, but both indexes remain well above the 50 level that separates growth from contraction.
ISM Services and Manufacturing Index Charts
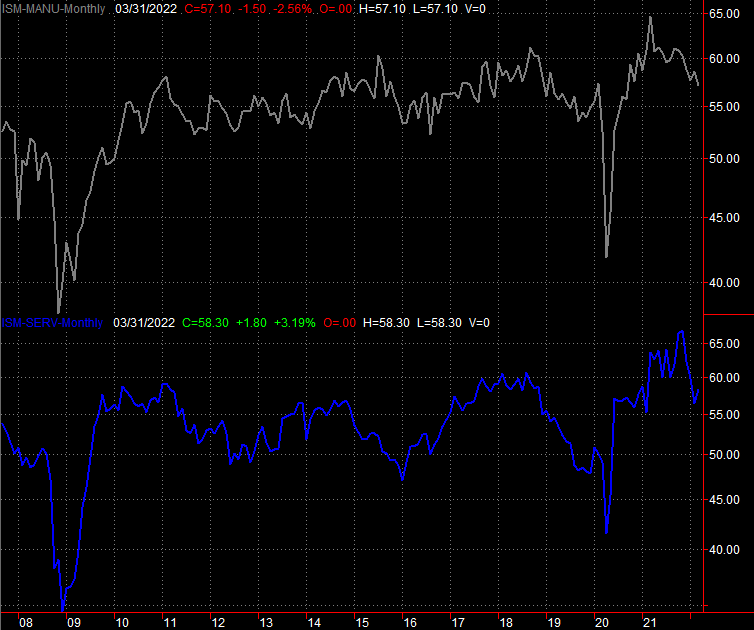 [1]
[1]
Source: Institute of Supply Management, TradeStation
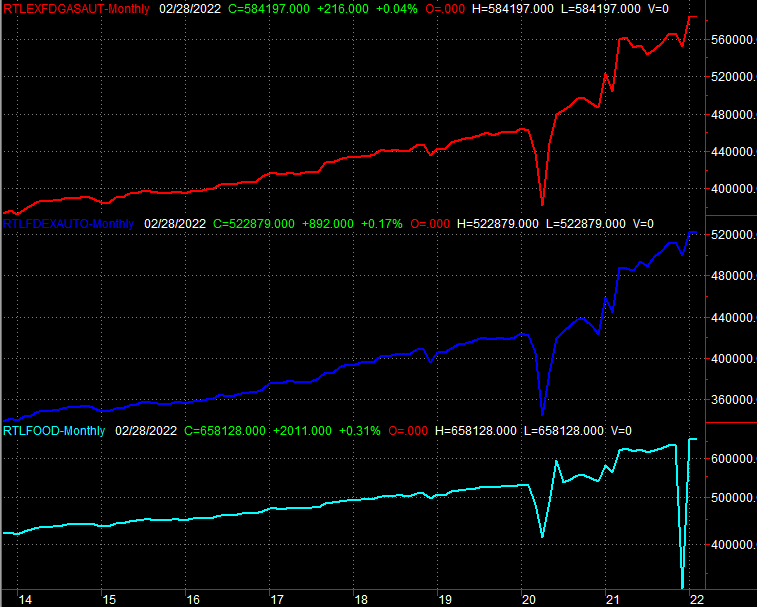
Though we don't chart it, it's also worth pointing out that last week's mortgage applications once again fell, and factory orders also contracted in February after a strong showing in January. Simply put, the economic engine is slowing down, even if it's not stalled yet.
Everything else is on the grid.
Economic Calendar
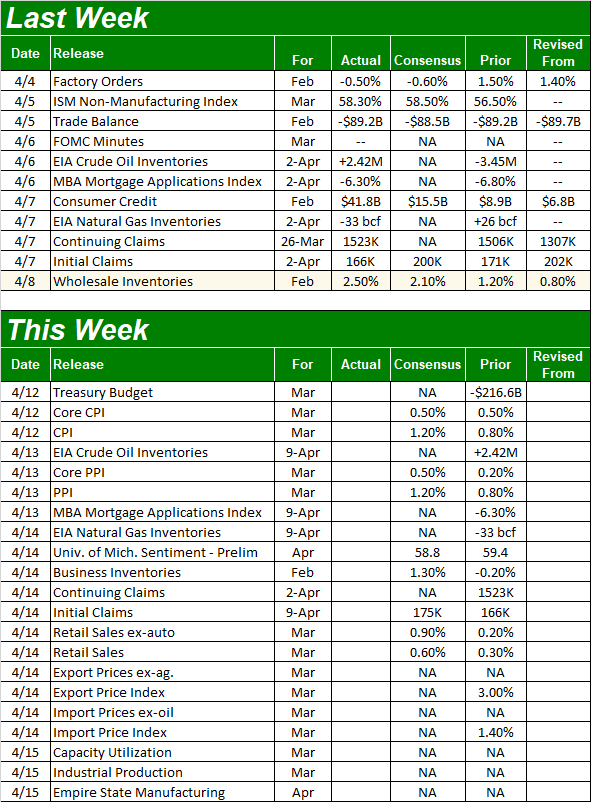 [2]
[2]
Source: Briefing.com
We'll likely be reminded of at last part of the reason the economy is running into a headwind this week, when we get last month's consumer and producer inflation reports, on Tuesday and Wednesday, respective. Incredibly, not only are both sets of data expected to remain uncomfortably high, they're expected to grow again from February's only-slightly-muted price hikes. Even on a core (ex-food and ex-fuel) basis prices are still frustratingly high.
Consumer and Producer Inflation Rate Charts
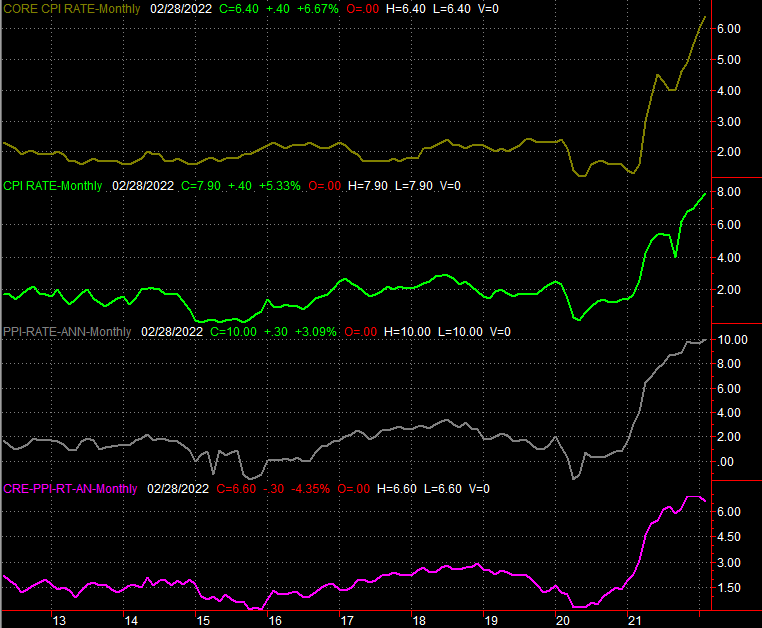 [3]
[3]
Source: Bureau of Labor Statistics TradeStation
On Thursday look for last month's retail spending report. Forecasters are calling for another round of increased consumption, with and without automobiles being factored in. Some of the spending increases can be chalked up to higher prices. Make no mistake though. After a couple of years' worth of pandemic-prompted austerity, the world's getting back to its pre-pandemic consumerism.
Retail Sales Charts
 [4]
[4]
Source: Standard & Poor's, Case-Shiller, FHFA, TradeStation
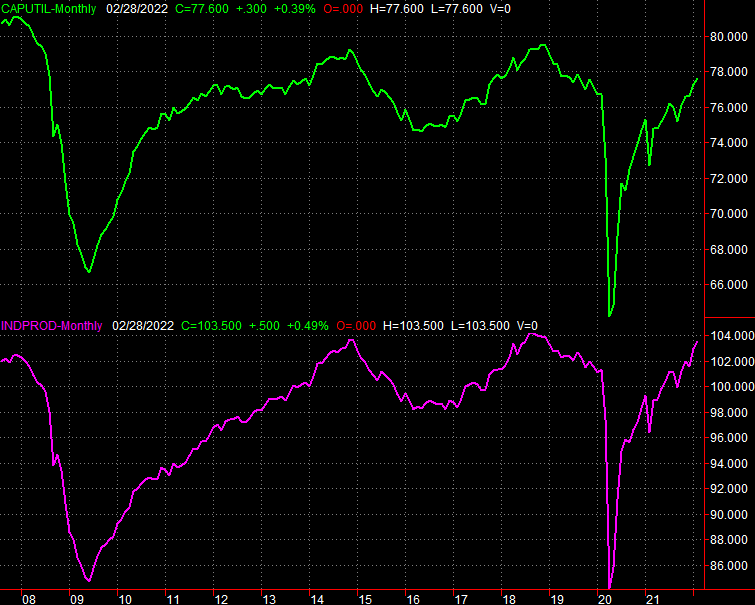
Finally, on Friday we'll hear March's capacity utilization and industrial productivity report from the Federal Reserve. Estimates were not available as of the time of this analysis' publishing. We do know, however, that as of February at least these two measures continued to improve from their pandemic lows.
Capacity Utilization and Industrial Productivity Charts
 [5]
[5]
Source: Federal Reserve, TradeStation
Yes, the Fed's utilization and productivity data conflicts with the Institute of Supply Management's measures. Since the ISM data is a poll and the Fed's data is actual finite data, in general, we're inclined to give it more credence. The trouble is, the ISM's reports may reflect what supply managers sense is coming, where as the Federal Reserve's numbers are only historical, even if absolutely factual.
Stock Market Index Analysis
Simply put, the market is caught between a rock and a hard place. Or, perhaps it would be more accurate to say stocks are on the fence, and could just as easily teeter to one side as the other.
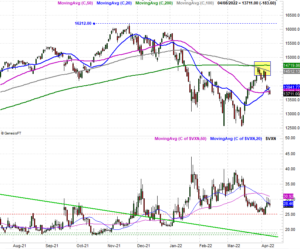
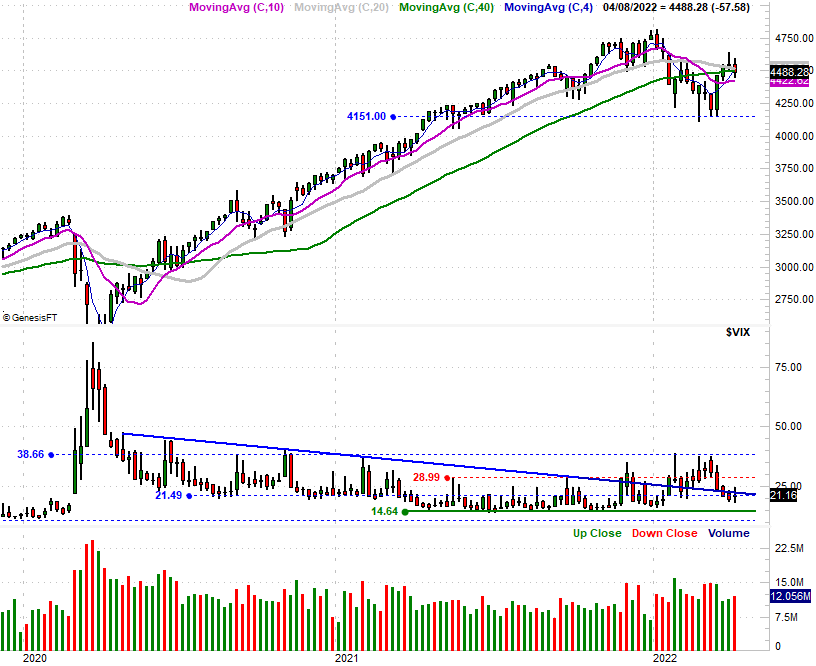
The daily chart of the S&P 500 below makes this crystal clear. As you can see, the index is parked right at its 200-day moving average line (green) at 4491. In fact, it's been stuck right at that line for the past three trading days, and has been resting right on the 20-day moving average line (blue) for the same number of days. At the same time, the S&P 500 is just as much under its 100-day line (gray) that it's above its 50-day moving average line (purple). Traders, in a nutshell, aren't looking to make a firm commitment either way.
S&P 500 Daily Chart, with VIX and Volume
 [6]
[6]
Source: TradeNavigator
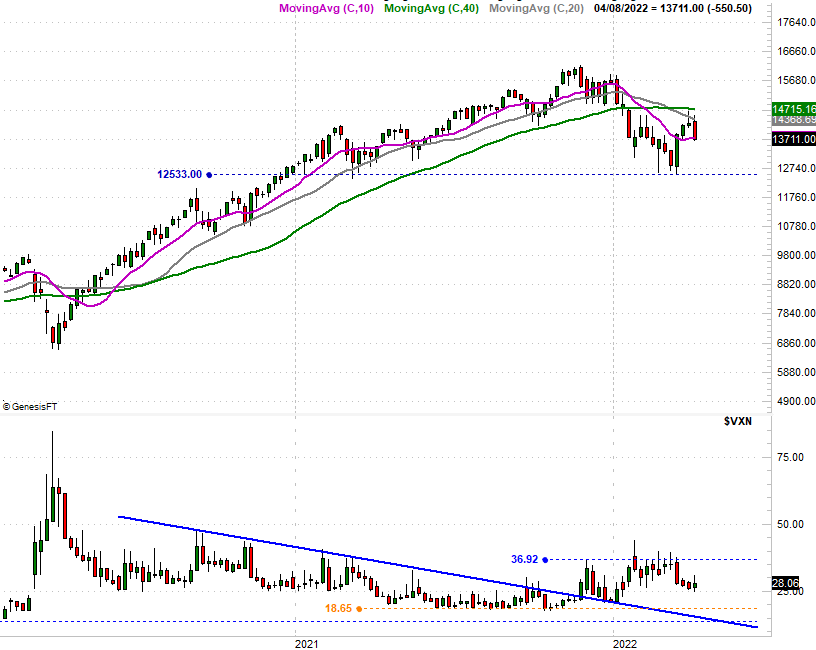
Curiously (or maybe not), the NASDAQ Composite isn't nearly as stuck-in-the-middle. With Friday's selloff the composite fell under its 50-day moving average line (blue), dragging it below all four of its key moving averages after finding resistance at its 100-day moving average line (gray, highlighted) a couple of weeks ago.
NASDAQ Composite Daily Chart, with VXN
 [7]
[7]
Source: TradeNavigator
It's a conundrum to be sure, though one that shouldn't last too much longer. You just have to be patient before pulling the trigger.
It's an underappreciated nuance of the market, but big, prolonged moves are reliably followed by periods of volatile non-movement that sets up another big, prolonged move. Sometimes that follow-on action is pointed in the same direction as the prior move, and other times it carries stocks in the other direction. Whatever is due next, know that the past four months is one of those volatile non-net-movement periods that's setting up something that should be long-lived.
This idea is much easier to spot on a weekly chart than a daily chart, so let's look at a weekly chart of the S&P 500. The past four months look much different — and tractionless — than most of the past two years have been.
S&P 500 Weekly Chart, with VIX and Volume
 [8]
[8]
Source: TradeNavigator
There's an easy clue to use to spot the transition from an efficient to an inefficient market environment. Check out the moving average lines on the weekly chart of the S&P 500 above. By the middle of 2020 they were all diverging away from one another as the market accelerated into what would become a nearly a two-year rally. Over the course of the past four months, those moving average lines have converged… almost back to a single point. And, the S&P 500 itself is almost trading right at that point.
This is about as "return to the mean" as you can get. Now that all the excess bullishness and profit-taking has been wrung out, the stage is set for a new divergence of all those moving average lines. (Yep, here we go again.)
Which direction might that be, and how big might that move carry stocks? We don't know the answer to either question. We can only pay attention to the clues as they materialize. But, the fact that the NASDAQ Composite ended last week below all of its key moving averages lines is an important clue to keep in mind.
NASDAQ Composite Weekly Chart, with VXN
 [9]
[9]
Source: TradeNavigator
Here's another clue to keep in mind… not only is the NASDAQ's weak close last week a red flag, the composite's 200-day moving average line (green) is now sloped downward. That's a sign that the bigger-picture trend is now officially bearish. Only time will tell if that's an omen of what's to come.