A little profit-taking last week didn't come as a big surprise, particularly in light of rekindles trade war fears. Though nobody really thinks geopolitical tensions will snowball into a global recession, that was the rhetoric-of-the-day for a couple of days last week. As has been the case several times in recent weeks, however, traders were mostly expecting a lull, followed by a move to even higher highs.
 [1]The market, however, didn't exactly finish last week on a high note. On Thursday the market was up-ended, and pulled back under a relatively meaningful support line. It tried to recover on Friday, and it did to a modest degree. When push came to shove later in the day though, the bulls weren't biting. We may get the June swoon yet.
We'll weigh it all below, as always, after a run-down of last week's and this week's economic announcements.
Economic Data
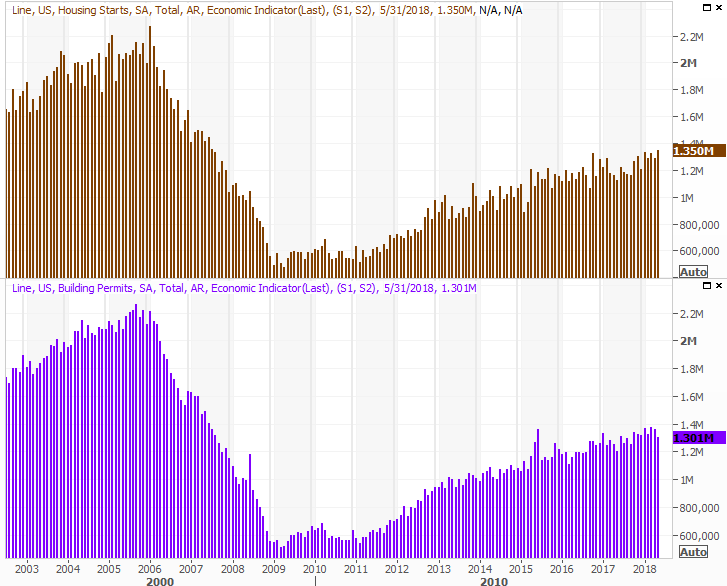
Not a very busy week last week, though it was a big one for the real estate market. Aside from a couple of home-price index updates, we got a look at last month's housing starts and building permits reports. Both were pretty good, with starts rolling in better than expected. Though neither is moving higher in a straight line, both are moving higher, yet neither has reached the pre-2007 breakneck pace that wound up being unsustainable.
Housing Starts and Building Permits Charts
 [2]
[2]
Source: Thomson Reuters
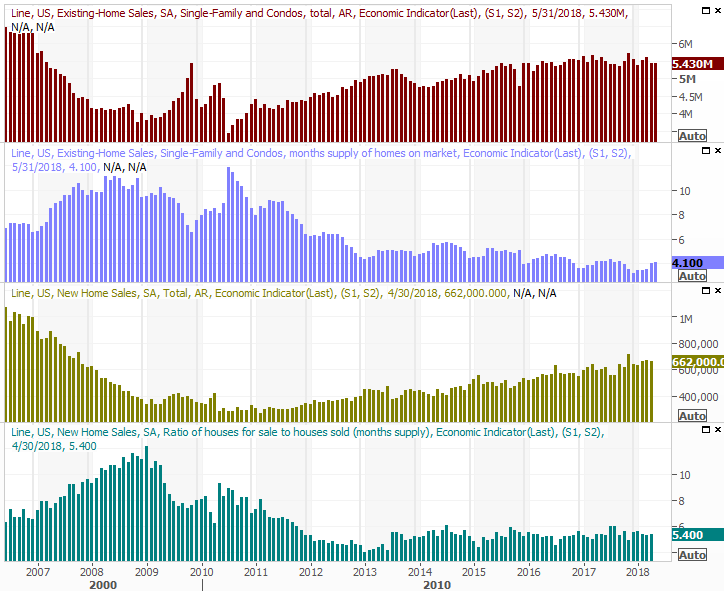
Though we won't get May's new-home sales numbers until this week, if they're anything likes last month's existing home sales data, there's a lot to look forward to… sort of. Existing homes were sold at an annualized clip of 5.43 million. That pace is slowing, and though limited inventory might be contributing to the problem, a lack of inventory has been less of a problem the last couple of months.
Home Sales and Inventory Charts
 [3]
[3]
Source: Thomson Reuters
This week's new-home sales report should show another slight increase, while new-home inventory levels will likely roll in flat… again.
Between the new and existing categories, real estate growth isn't red hot, but is respectable.
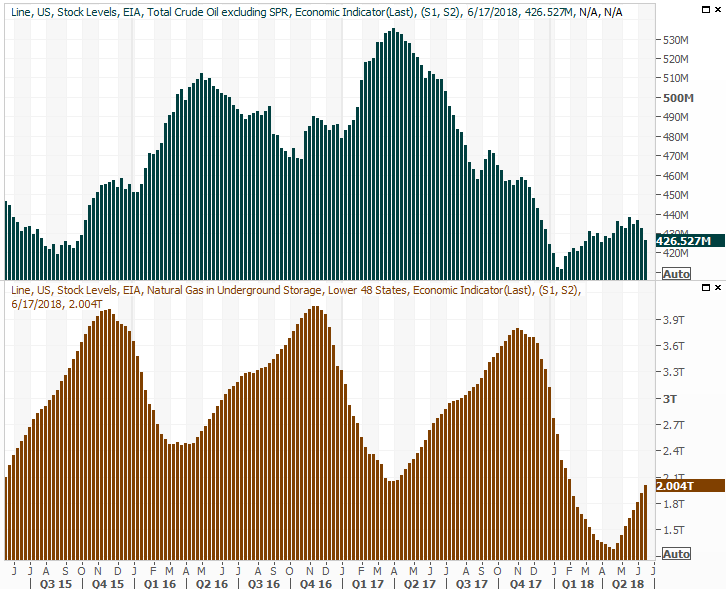
Last but not least, last week's crude oil inventory report indicated a second week of inventory dropoff, backed by a decision from OPEC to keep their supply relatively tempered. There was some concern that a relatively undisciplined energy would once again overreact to higher oil prices, and set the stage for the kind of overflow we saw take shape into 2016. That may not be what's on the docket this time around though.
Crude Oil, Natural Gas Inventory Charts
 [4]
[4]
Source: Thomson Reuters
Two weeks don't make a trend, but all big trends start as small ones.
Clearly the lid has yet to be put on natural gas production, which is experiencing just as much demand growth. From a fiscal impact and ripple effect though, it's oil prices that can really help or hurt the global economy.
Everything else is on the grid.
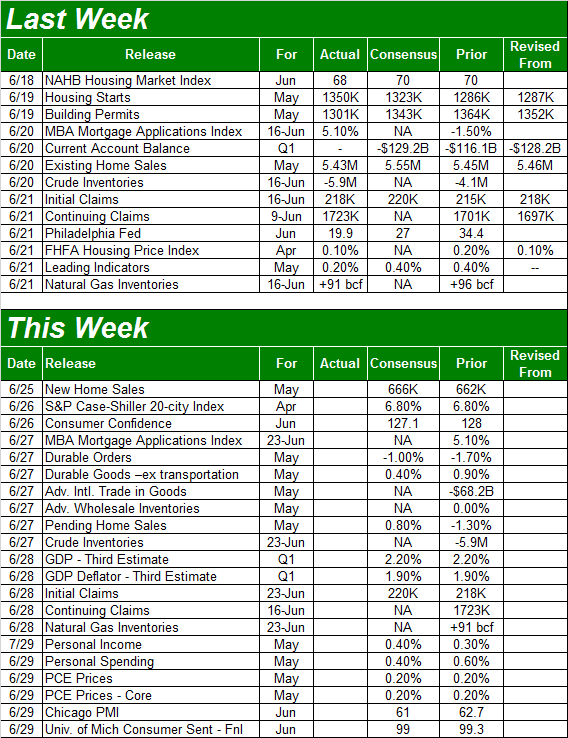
Economic Calendar
 [5]
[5]
Source: Briefing.com
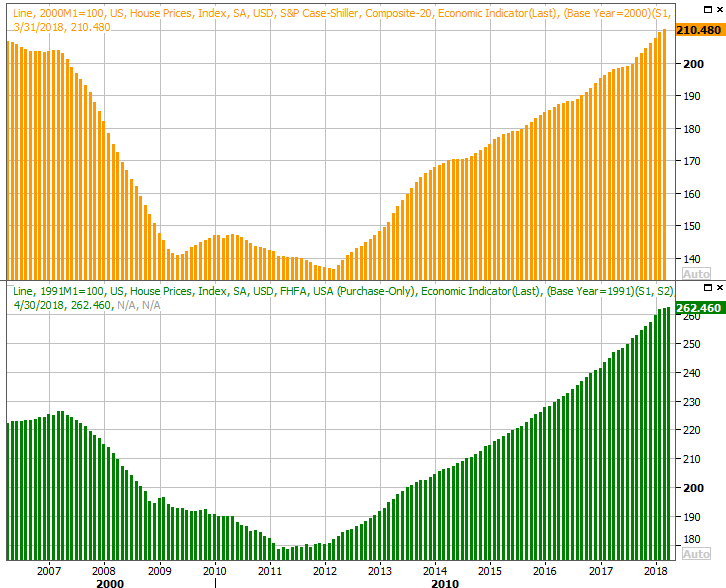
This week we'll get the aforementioned (and already previewed) new-home sales report, as well as the Case-Shiller Index to round out the FHFA Housing Price Index report we got last week. The latter grew in April, and the Case-Shiller is expected to grow as well. It's this ongoing strength in home prices that bleeds off some of the worry about the flat-lining of existing-home sales. The overall picture is still pretty healthy.
FHFA, Case-Shiller Home Price Charts
 [6]
[6]
Source: Thomson Reuters
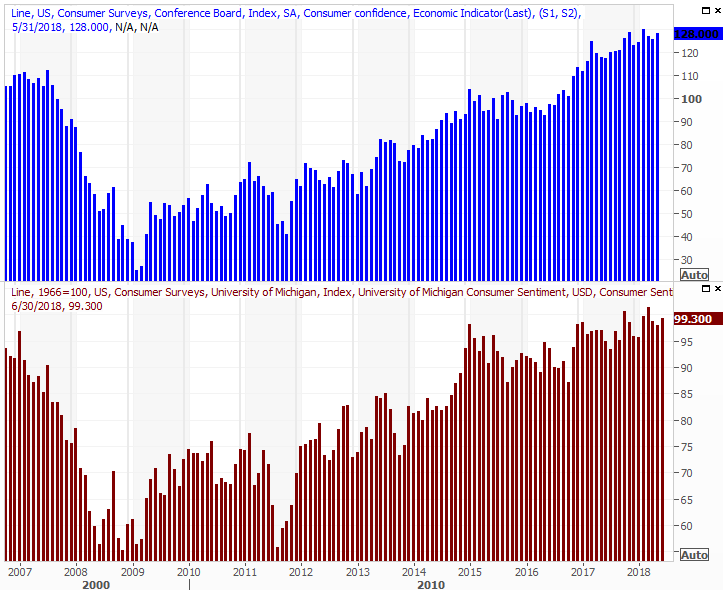
It's also going to be a big week for looks at consumer sentiment. We'll get our third and final look at June's Michigan Sentiment Index on Friday, but first we'll hear from the Conference Board about its consumer confidence reading on Tuesday. Economists are looking for a slight dip from the Conference Board's look, and Michigan's read. In both cases though, the overall uptrend is clear.
Consumer Sentiment Charts
 [7]
[7]
Source: Thomson Reuters
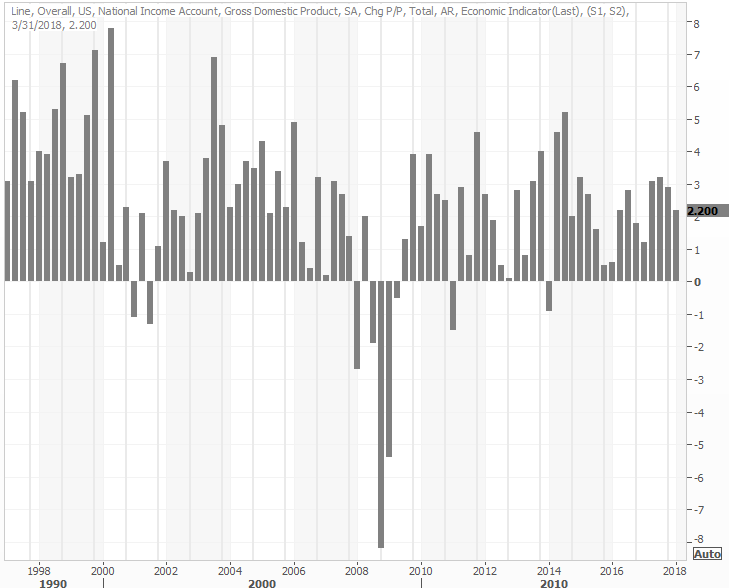
Finally, this week we'll get our third and final read on Q1's GDP growth rate (right as we wrap up calendar Q2!) It's expected to remain at 2.2%, though just for the record, the second quarter's GDP growth estimates range from 3.5% to 4.5%. That's a no-gimmick outlook too, meaning it's not being compared to a miserable or negative Q2-2017 figure. That would be one of the best growth paces in years, and the first "no gimmick" growth paces in even longer.
GDP Growth Charts
 [8]
[8]
Source: Thomson Reuters
Index Analysis
It coulda been worse. But, it coulda been better too. The market didn't move into a freefall last week, but the budding breakout effort was quelled pretty quickly. And, all the major indices ended last week pointed in a bearish direction.
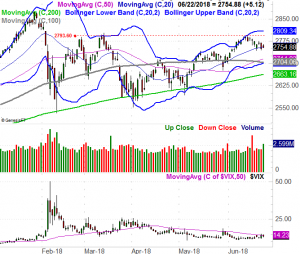
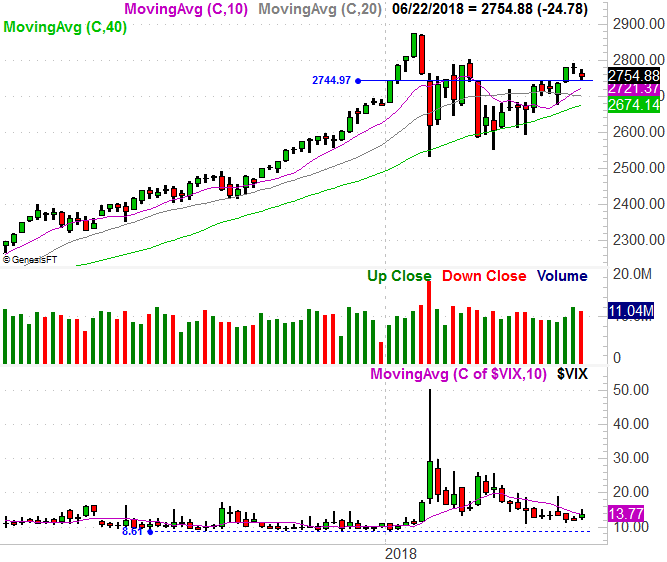
Take a look. Rather than punching through the ceiling at 2793.6, the S&P 500 peeled back, starting to test the 20-day moving average line as a technical support level.
S&P 500 Daily Chart, with VIX and Volume
 [9]
[9]
Source: TradeNavigator
That support is made stronger by the fact that it was a technical ceiling just a few weeks ago; the index topped out there a couple of weeks in May.
S&P 500 Weekly Chart, with VIX and Volume
 [10]
[10]
Source: TradeNavigator
This is a tricky scenario for traders. The bigger-picture undertow is bullish (albeit inconsistently), but most traders quietly know stocks have been artificially inflated by hype of late. We're also walking into a time of year that's generally bearish for the market.
That's the long way of saying things could still go either way… even in just the near term.
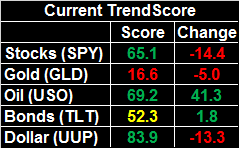
Still, the "call" is a bullish one. The TrendScore for stocks remains bullish, particularly in light of the fact that the key index is finding some support here. But, that bullishness is contingent on how the VIX behaves from here.
And, it's been relatively impressive. Even though the S&P 500 took a pretty hard hit last week, the VIX didn't surge, suggesting investors were neither surprised nor scared. As long as traders aren't spooked, they're not going to send the market into a freefall. If the VIX does start to poke above its 50-day moving average line though (at 14.2), take note. If it pushes above 18.8, where it peaked, that's trouble… especially if that coincides with a break below the 2704 or 2663 levels from the S&P 500.
That's a lot of "if" though. This still remains a day-to-day affair, and a break above 2793.6 could just as easily incite another respectable bearish leg.