
 [1]Not surprisingly, after a monster-sized four-week rally, the bulls finally took a break. Even with last week's modest pullback though, it's difficult not to at least lean towards a bullish near-term future. We're seeing glimmers of political sanity again, and we ended the shortened-trading week on a bullish foot. That is, Friday – the only really bullish day of the week – wiped away most of the red.
There are still a couple of key hurdles ahead, and we're still just one bad headline away from the rug being pulled out from underneath the market. But, investors are more confident in stocks now than they've been in weeks. That's a start.
We'll weigh it all below, and formulate a plan. But, first, let's run through the economic news we're getting that hasn't been stifled due to the government shutdown. This is going to be a huge week, with a rate-hike decision coming on Wednesday and January's jobs report due on Friday.
Economic Data Analysis
Between the holiday and the government shutdown, there wasn't a great deal of information released that's worth sifting through here. There are a couple of items worth mentioning, however, that really help us get a grip on where the real estate market is, and isn't.
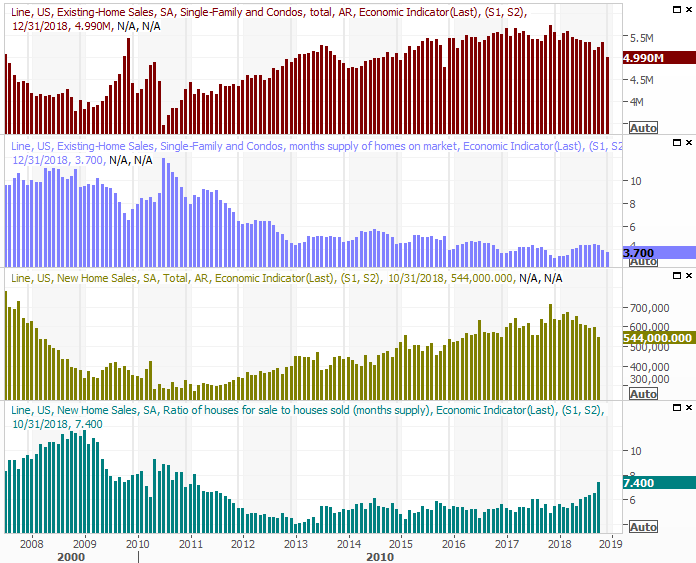
The first of those data nuggets is existing-home sales, which fell from a pace of 5.33 million in November to an annualize rate of 4.99 million last month. That's the slowest rate seen since November of 2015… and that one was a fluke. Trend-wise, that's the weakest since 2014. Though we didn't get the figure, presumably, sales of new homes are also continuing to falter.
New and Existing Home Sales, Inventory Charts
 [2]
[2]
Source: Thomson Reuters
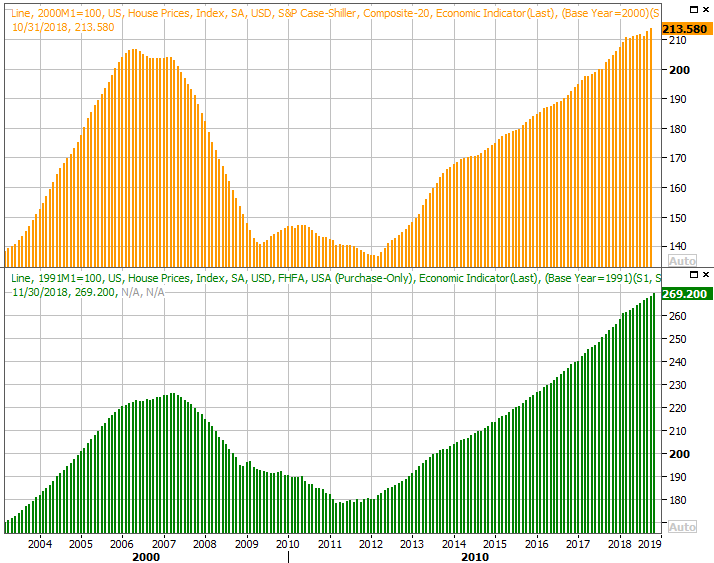
The one upshot? Inventory of existing homes for sale is burning off, keeping home prices relatively firm. In fact, that was part of the other information we got last week regarding real estate. FHFA is still posting its data, and said home prices continued to rise through November.
Home Price Charts
 [3]
[3]
Source: Thomson Reuters
The S&P/Case-Shiller Home Price Index will be reported on Tuesday, though it's unlikely to vary much from the FHFA's trend. It's not clear when the Bureau of Labor will catch up with its new-home sales reports that aren't being shared during the government shutdown, but it's unlikely to be much different that the existing-home sales trend.
Everything else is on the grid.
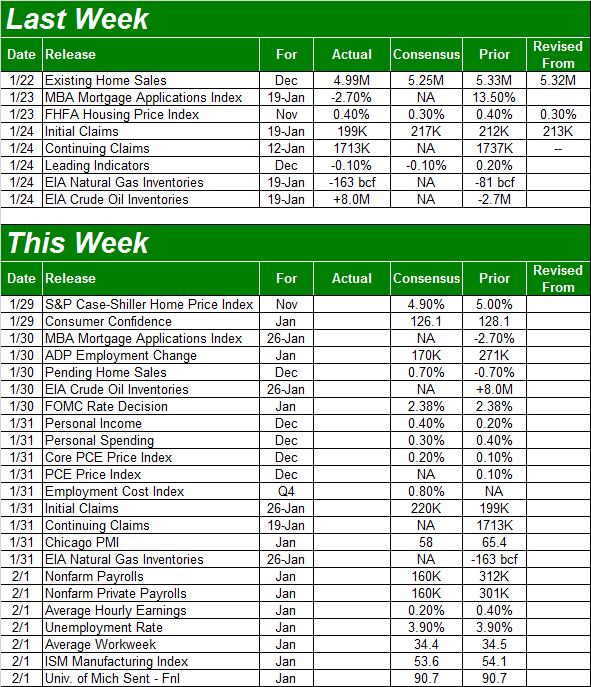
Economic Calendar
 [4]
[4]
Source: Briefing.com
This week is going to be a busy one, though it's possible some of these reports won't be given if the government isn't reopened by the time their due. We're assuming, however, all will be posted as usual.
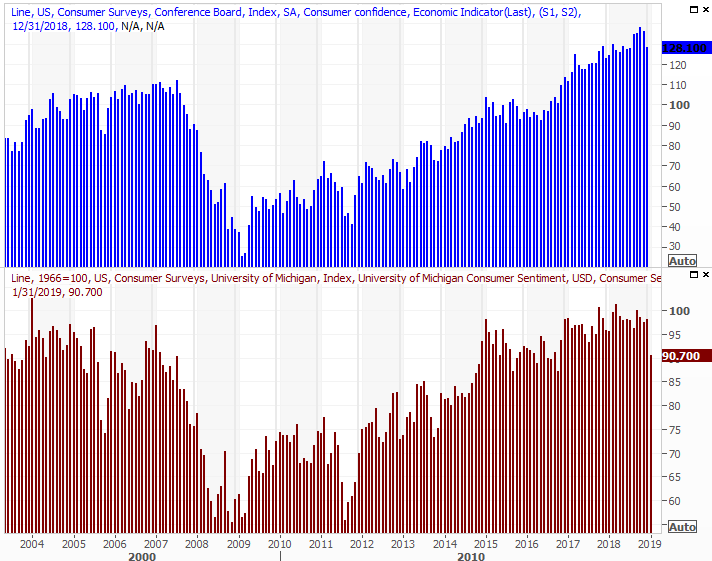
It's a particularly big week for consumer confidence. The Conference Board will report its confidence score on Tuesday, which will be followed by the third and final reading of the Michigan Sentiment Survey for January on Friday. The most recent looks haven't been encouraging, with scores sliding lower on worries about the impact of a mostly-shuttered government. The pros expect scores to fall again for this month. Just bear in mind these surveys may reflect frustration over an unnecessary government shutdown more than they actually reflect decreased spending or waning hope.
Consumer Sentiment Charts
 [5]
[5]
Source: Thomson Reuters
Buckle up on Wednesday. That's when the Federal Reserve will have its next chance to impose a rate hike. The expected plan was for three interest rate increases this year, but in light of recent turbulence, the FOMC may not be in any hurry to put them in place. Traders are pricing in a 99.5% chance the Fed will NOT raise rates.
Just as big will be Friday's jobs report, in light of the shutdown and the potential ripple effect it may have.
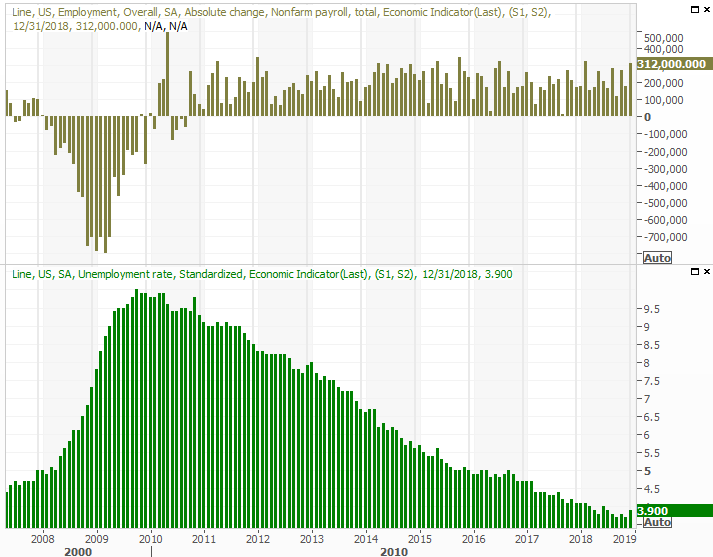
Economists are still expecting solid numbers, despite the shutdown. Nonfarm payrolls are expected to grow by 160,000 after December's big figure of 312,000 jobs. That won't be enough to move the unemployment rate needle from 3.9%, but at 3.9%, it's about as low as it can get. Just bear in mind we could see anything under the sun, given the situation. Just bear in mind whatever numbers we get could be easily reversed (in either direction) depending on what happens or doesn't happen within the next few days.
Payroll Growth and Unemployment Rate Charts
 [6]
[6]
Source: Thomson Reuters
Stock Market Index Analysis
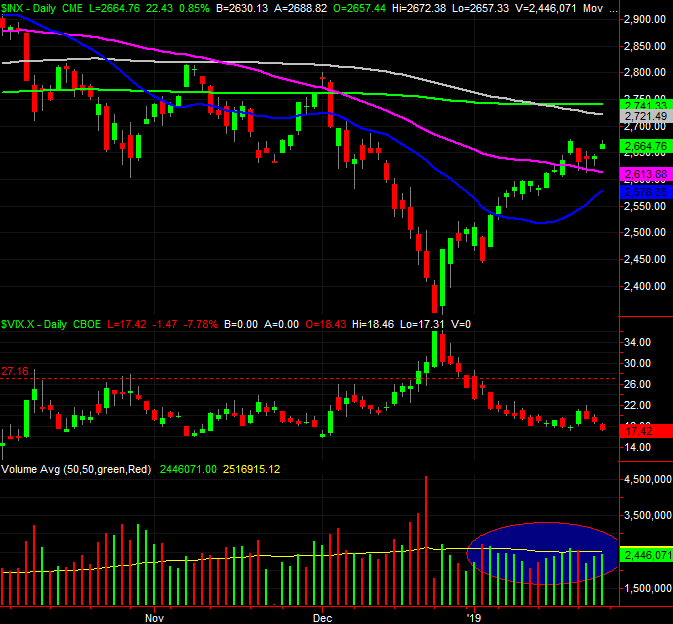
The rally may have stalled last week, but that can't be terribly surprising, or concerning. As of the week before, the S&P 500 was up 13.6% in what was less than a four-week span, and in need of a breather. Thing is, a whole lot of heavy lifting was done before last week. Namely, the S&P 500 fought its way back above the 50-day moving average line (purple) as of two Friday's ago, and it's still there.
S&P 500 Daily Chart, with Volume
 [7]
[7]
Source: TradeStation
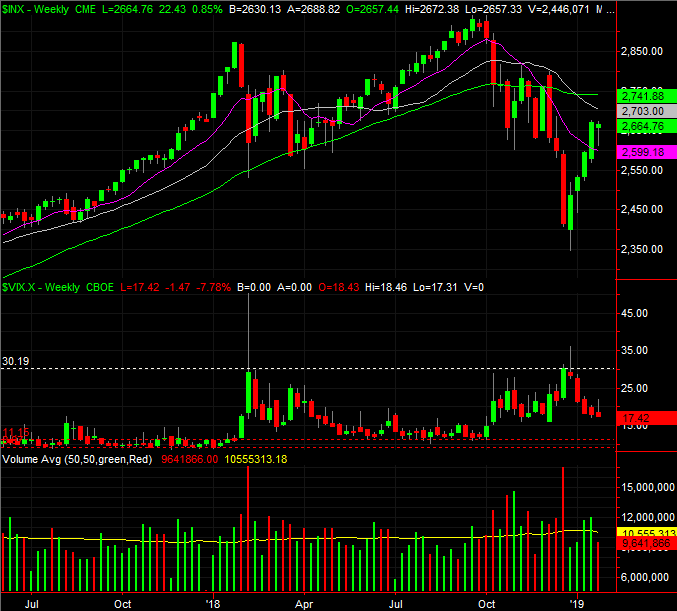
It's not ideal. The index left behind a bullish gap on Friday morning, and the market generally doesn't like to leave unfilled gaps. Traders may feel the need to go back and fill it in before moving on. But, it can do that without falling back below the 50-day moving average line at 2614. And, as the weekly chart below illustrates, the VIX still has plenty of room to fall before bumping into its absolute floor near 10.0.
S&P 500 Weekly Chart, with Volume
 [8]
[8]
Source: TradeStation
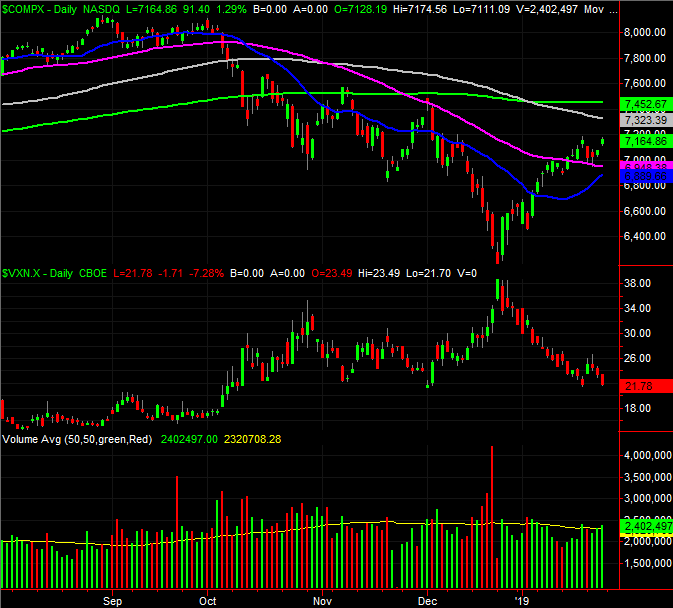
The same basic highlights also apply to the NASDAQ Composite. That is, the NASDAQ is also now above its 50-day moving average line, the VXN has lots of room to keep falling, and there's plenty of volume behind the advance. In fact, there's more (and more growing) volume with the NASDAQ's recent gain than there is with the S&P 500.
NASDAQ Composite Daily Chart, with Volume
 [9]
[9]
Source: TradeStation
Still, in this environment, anything can happen, and most conventional forms of analysis may or may not be applicable or helpful.
In environments like this one, where traders may say one thing and do another – or say something but mean something else – it's often helpful to measure market sentiment. The VIX and VXN do this, but just as beneficial is a review of the put/call (options) ratio.
That's the image below… the S&P 500 on top, and a moving average, or trend line, of the market's put/call daily volume ratio. It soared above 1.0 in late October and late December, coinciding with what turned out to be major market bottoms, but it's still miles away from falling back to the 0.75 area that usually coincides with market tops. It's not a perfect correlation, but the tendency is apparent.
S&P 500 vs. Equity Put/Call Ratio
 [10]
[10]
Source: TradeStation
It's not wildly conclusive, but it does make clear that traders haven't become unrealistically, dangerously oblivious to risks here. If and when the put/call ratio's trend line falls back to the 0.75 area, that would be a reason to worry.
In that same vein, the TRIN Index – or Arms Index – confirms there's some room for the market to keep running higher before the rally isn't supported by traders. But, the Arms Index comes to a similar conclusion using a different set of data.
The Arms Index is, in simplest terms, a comparison of the market's up and down volume to its advancers and decliners. In a normal, well-supported trend, the Arms Index should more or less hover around one, suggesting the market's gainers or losers have commensurate volume behind those moves. Problems arise, however, when the volume data and the advancer/decliner data don't quite jibe. That's when the TRIN's trend line, or moving average of the daily data, moves to extreme high or extreme low levels.
The image below compares the S&P 500 to the NYSE's Arms Index trend. When the Arms Index got too high – around 1.20 — it indeed meant a bottom. Conversely, when the TRIN trend line fell below 0.90, it often corresponded with a market top. Take a look.
S&P 500 vs. Arms Index Trend
 [11]
[11]
Source: TradeStation
Like the put/call tool, this one isn't perfect. It arguably shouldn't be the sole basis for any major directional call. But, it's certainly a powerful support tool that helps keep the market's condition at any given time in the proper context. And right now, the Arms Index and the put/call ratio are both saying the uptrend in motion isn't a hollow fluke. Unless something dramatic changes, there's room and reason to expect more upside.
That said, note that the market's most familiar tech names report earnings this week. That could be dramatic, though that drama may well be bullish.
This week is going to be a week the bulls really need to prove they believe in the current rally. Hurdling the 100-day and 200-day moving average lines could really seal the deal, but we're not over those humps just yet.
Stay tuned.