
The month of April may have been a winning one for the market. But, stocks didn't end the month on a high note the bulls were hoping for. While the indices logged bullishness on Thursday and Friday, that move wasn't enough to get any of them above the technical ceilings that were standing in the way just two weeks back. The market only moved back to those levels, leaving them within striking distance of that resistance. One more day could get them over the hump.
We'll look at the effort in some detail in a moment. Let's first run through last week's biggest economic news and preview what's coming this week. Spoiler alert: Friday's jobs report has the potential to rattle the market, for better or worse.
Economic Data Analysis
It was a big week, particularly for real estate. As it turns out, things are a bit better than it seems like they would be at this time.
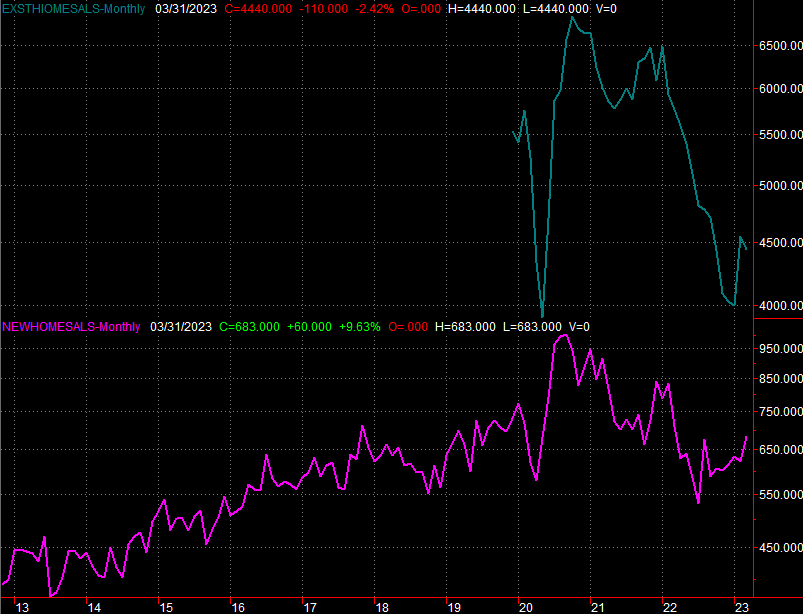
Take last month's sales of new homes as an example. Economists were calling for an improvement from February's annual pace of 623,000 to 630,000, but sales actually jumped to a multi-month high of 683,000 per year. The move further pushes the rebound effort into place from last year's low.
New, Existing Home Sales Charts
 [1]
[1]
Source: Census Bureau, National Association of Realtors, TradeStation
Also note that while last month's existing home sales slipped slightly, they slipped from an impressive gain in February.
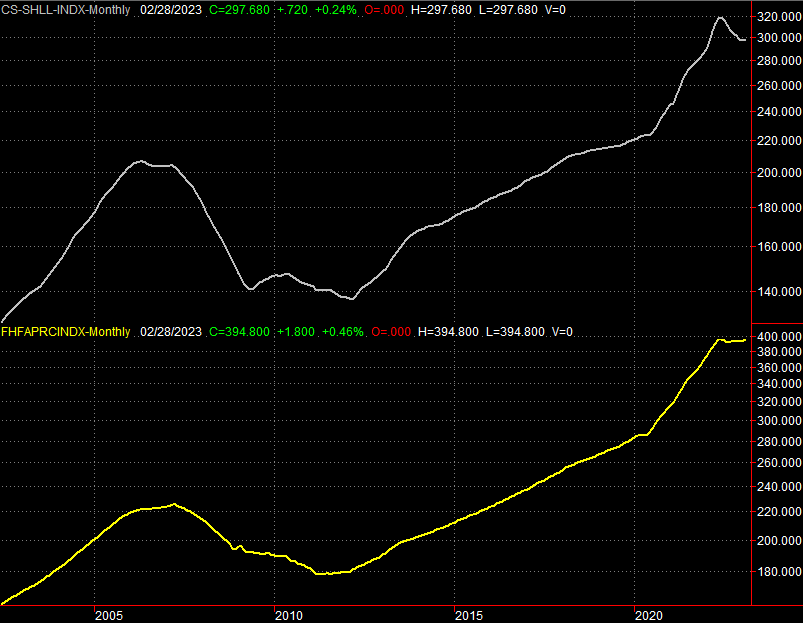
And that's not the only data that says real estate is in many ways on the mend. Home prices ticked higher in February following January's forward progress, topping expectations.
Home Price Index Charts
 [2]
[2]
Source: Standard & Poor's, FHFA, TradeStation
It's not charted here, but know that personal spending was flat in March (versus February's slight lull), while personal income grew even more than anticipated as well.
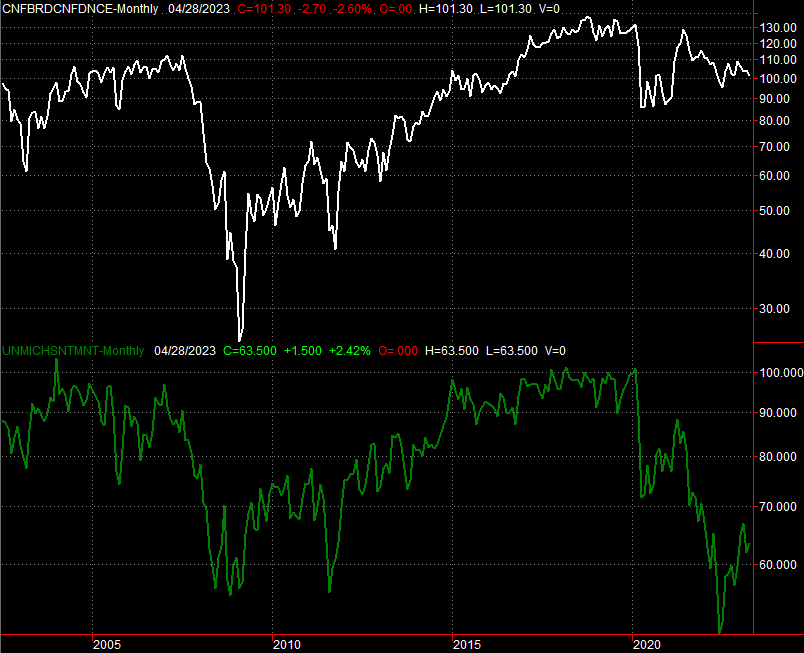
Except, while people may be spending a little more and doing more buying of homes, broadly speaking they're not exactly stoked about the foreseeable future. The Conference Board's consumer confidence reading continues to edge lower, and while the University of Michigan's consumer sentiment reading improved a little bit in April, it's still at abnormally low levels.
Consumer Sentiment Charts
 [3]
[3]
Source: The Conference Board, University of Michigan, TradeStation
These people may be well aware that the first quarter's GDP was lackluster. The forecast was for 2.0% growth, but the first (of three) estimates says the economy only grew to the tune of 1.1% in Q1.
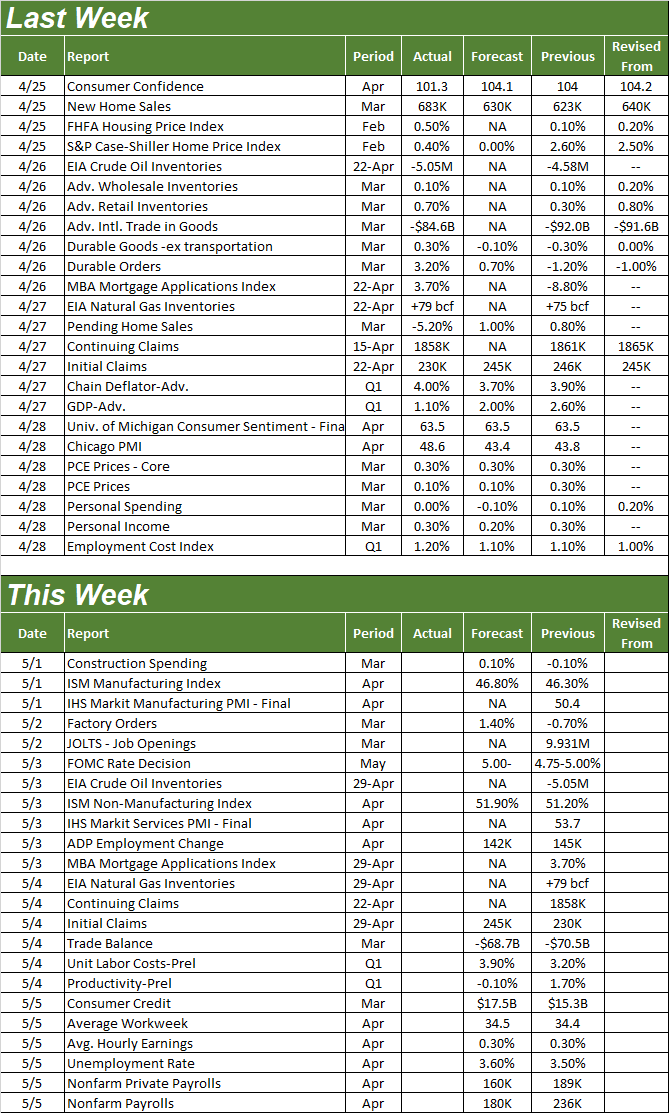
Everything else is on the grid.
Economic Calendar
 [4]
[4]
Source: Briefing.com
This week will serve up two big items.
The first comes from the Institute of Supply Management. The manufacturing index for April will be updated on Monday, with the services index due on Wednesday. Each is expected to improve slightly for the month, but only the services index is currently above the critical 50 level. Regardless, both indexes are trending lower. The trajectory itself is a problem.
ISM Services, Manufacturing Index Charts
 [5]
[5]
Source: Institute of Supply Management, TradeStation
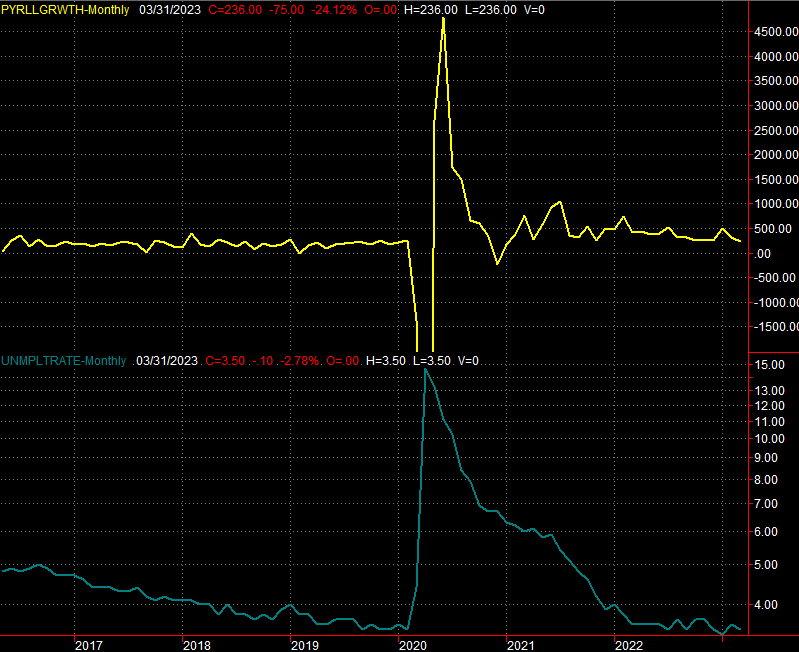
Friday's jobs report is worth watching. Economists expect payroll growth to slow down, pushing the unemployment rate higher. But, the current unemployment rate is already so low that there's little hope for more progress. That doesn't, however, mean the market won't overreact to or misinterpret the report.
Unemployment Rate, Payroll Growth Charts
 [6]
[6]
Source: Bureau of Labor Statistics, TradeStation
Stock Market Index Analysis
Stocks came close to breaking out. But, they didn't actually do so. And it doesn't matter which index you're talking about. They all ran into the same wall.
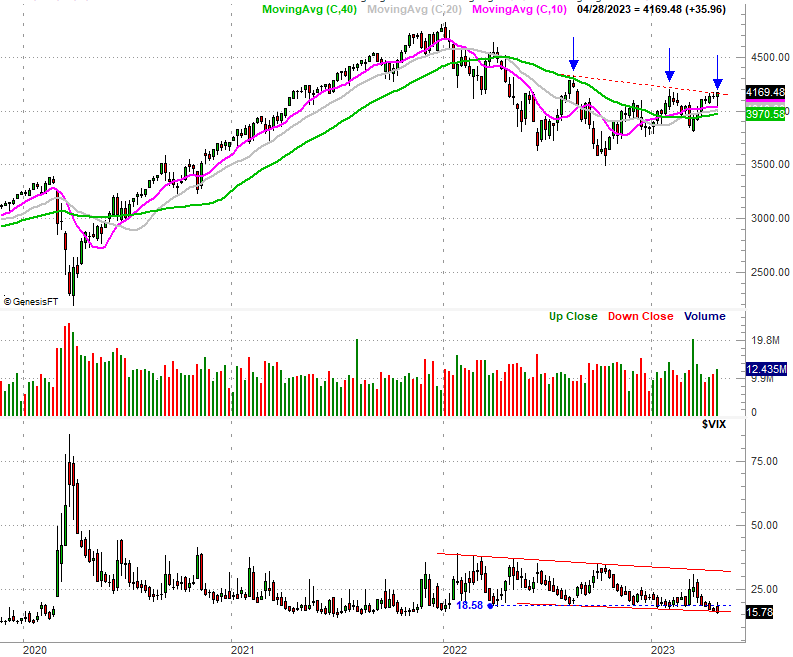
Take, for instance, the weekly chart of the S&P 500. Last week's high of 4170.06 touched the technical ceiling connecting the peaks from last week, early February, and mid-August (red, dashed), but didn't actually get over that ceiling.
S&P 500 Weekly Chart, with VIX and Volume
 [7]
[7]
Source: TradeNavigator
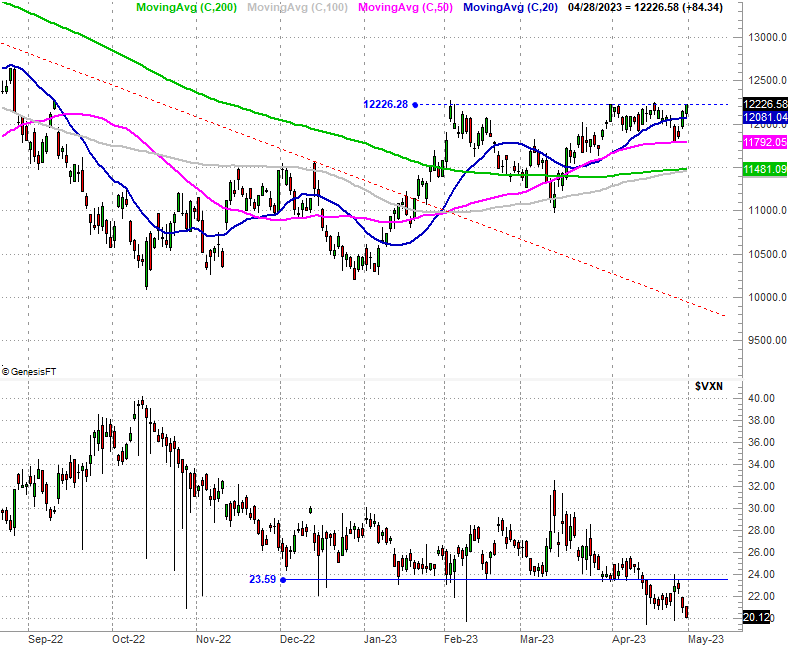
The NASDAQ Composite's in a similar — although not identical — situation. Last week's peak is in line with February's high near 12,226 (blue), but that's basically the level the composite's been stuck under for the past five weeks now. There's clearly something about that mark that's "in play." Ignore it at your own peril.
NASDAQ Composite Weekly Chart, with VXN
 [8]
[8]
Source: TradeNavigator
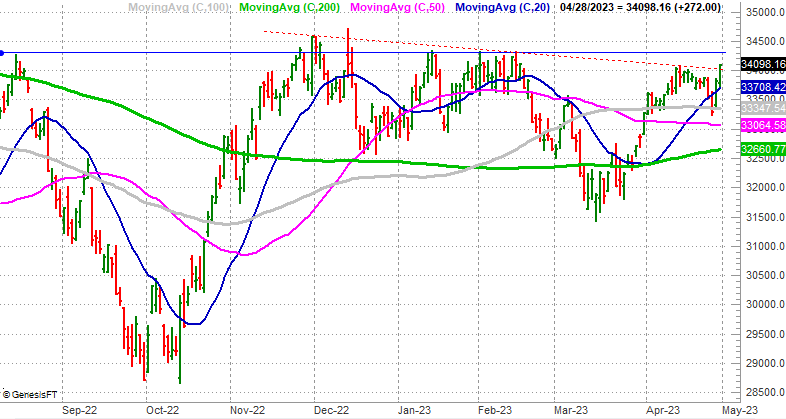
Even the Dow Jones Industrial Average is in a technical struggle, although it is offering up a little better glimmer of hope. The falling resistance (red, dashed) that's been steering it lower since early December was hurdled thanks to Friday's surge. Yet, even with that push the blue chip index remains under horizontal resistance (blue) at 34,313 that's been holding it down for most of the past seven months.
Dow Jones Industrial Average Daily Chart
 [9]
[9]
Source: TradeNavigator
There are other bullish glimmers too. The NASDAQ Composite is giving us a big one. While evident on the weekly chart, the daily chart of the composite highlights the fact that the index found solid support at its 50-day moving average line (purple) on Tuesday, pushing up and off of it to once again test the technical ceiling at 12,226. Also notice the NASDAQ's 100-day moving average line (gray) is about crawl above the 200-day moving average line (green) at 11,481. Once that happens, all four key moving averages will be bullish "stacked," meaning the each one is above the next-longest one. It's a sign that that the undertow has turned firmly for the better.
NASDAQ Composite Daily Chart, with VXN
 [10]
[10]
Source: TradeNavigator
Still, the ceiling IS in place. At the same time, both of the volatility indexes are at corresponding floors (see the weekly charts) that suggest the stock indexes themselves are at least at short-term highs.
Simply put, the market's on the fence here. The bulls have the edge though. There's tons of technical support below — at the moving average lines — and it's being successfully tested. The technical resistance is also still in play, but it's encouraging that the bulls at least keep testing these ceilings. If they continue to chip away at this resistance, eventually, it'll crack. Moreover, the longer it takes to chip away at these ceilings, the more explosive the breakout thrust can be once it finally takes shape.