
Through Wednesday of last week it looked like the market had a fighting chance at rebounding back into a bullish trend. Then Thursday came. Whammo. With that one bearish move, all the key indices broke key support levels they simply couldn't afford to break under. There wasn't a big buyback on Friday either, suggesting traders are in no hurry to test their luck by buying on the dip.
More important, yes, things can get worse before they get better. We've yet to see a really good fear-prompting capitulation, incredibly enough.
We'll show you how and why the fear we need to see to call it a bottom hasn't materialized yet in just a moment. First, let's review last week's biggest economic news and take a look at what's in the cards for this week.
Economic Data Analysis
Broadly speaking, economic forecasters have been leaning in an optimistic direction, even through two weeks back when we learned Q1's GDP likely contracted; sky-high interest rates are taking a toll. What's curious is that even with that dose of less-than-great news, expectations weren't dialed back. We likely paid a price for that unmerited optimism this week, when couple of economic reports didn't roll in quite as firmly as expected.
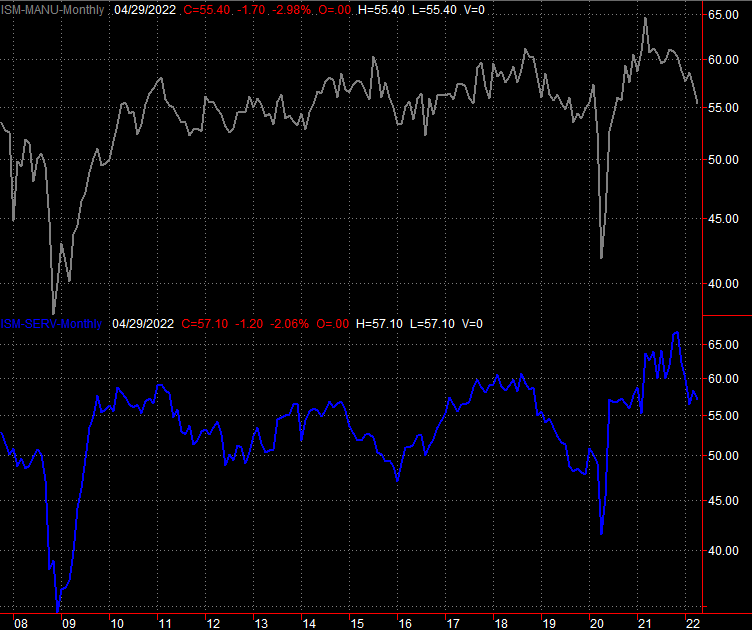
The Institute of Supply Management's looks at manufacturing and services activity for April are a prime example of this reality. Economists were expecting an improvement of both indices for last month compared to March's readings, but both actually fell — and by quite a bit — for April.
ISM Manufacturing, Service Index Charts
 [1]
[1]
Source: Institute of Supply Management, TradeStation
Payroll growth wasn't exactly thrilling either. Though the 428,000 jobs added in April matched March's number and came in better than the expectation of 395,000, that wasn't good enough to dial the unemployment rate down from 3.6% to the forecasted figure of 3.5%. Rather, it came in at 3.6% again… which isn't really bad, except for…
Payroll Growth, Unemployment Rate Charts
 [2]
[2]
Source: Bureau of Labor Statistics, TradeStation
… the Fed's completely-unsurprising decision to raise the Fed Funds Rate by 50 basis points, or half a percent. That should combat rampant inflation, but it could also take a toll on the already fragile economy. That in turn could work against stocks. Indeed, we're already seeing evidence of this connection. Rates were already on the rise even before the Fed did its thing, and we've seen lending activity slow since early this year. It's a question of finding the lesser of two evils.
In any case, everything else is on the grid.
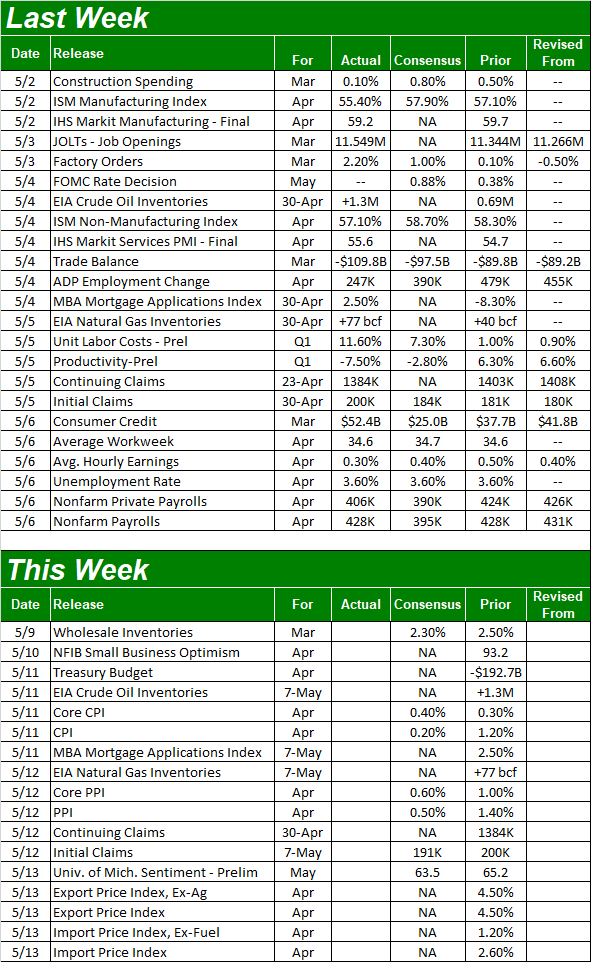
Economic Calendar
 [3]
[3]
Source: Briefing.com
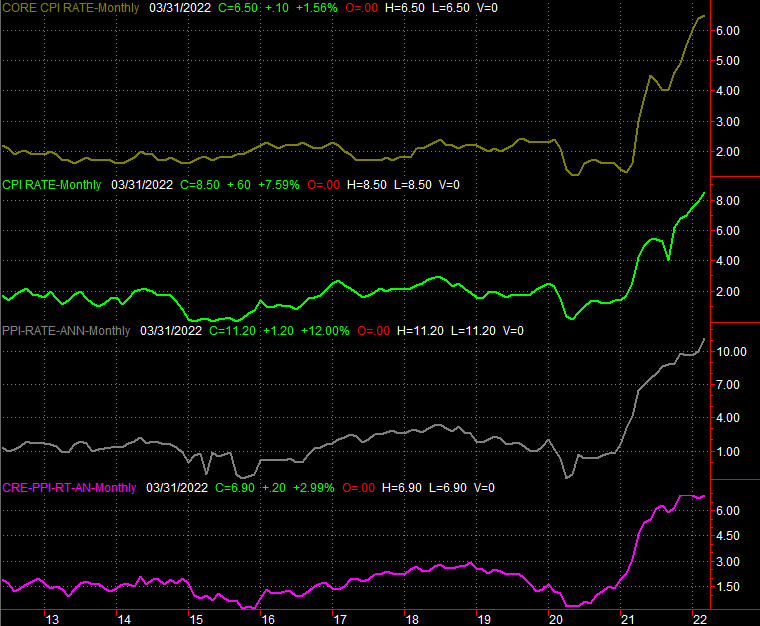
The only items of interest this week involve inflation. Consumer inflation figures for April will be posted on Wednesday, and producer inflation is coming in Thursday. Although interest rates have already been rising and the FOMC ratcheted rates higher last week, the impact of these actions isn't immediate. Economists expect inflation to have persisted as much as it has of late through last month.
Consumer, Producer Inflation Charts
 [4]
[4]
Source: Bureau of Labor Statistics, TradeStation
It could take a couple of months, in fact, for higher interest rates to really start to tamp down rising prices.
Stock Market Index Analysis
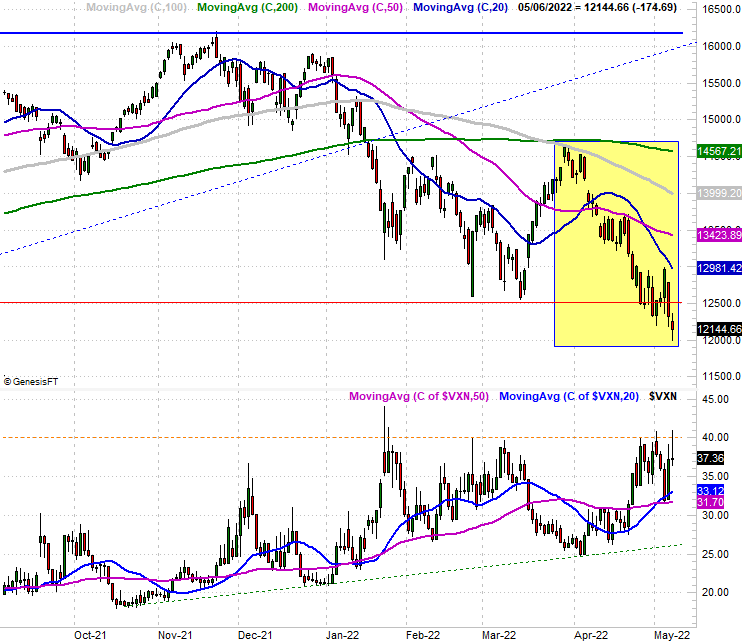
A week ago we pointed out how two Fridays ago the NASDAQ Composite broke under a major support level at 12,510. The index promptly reversed course (on an intraday basis) on Monday, and followed through all the way through Wednesday… spoiling our worry. As it turns out, we were right, even if it took a few days to see it. The NASDAQ crashed back under the important 12,510 level on Thursday of last week, and rather than bouncing back on Friday, the sellers continued to sell to leave the composite at its lowest close since November of 2020. Take a look.
NASDAQ Composite Daily Chart, with VXN
 [5]
[5]
Source: TradeNavigator
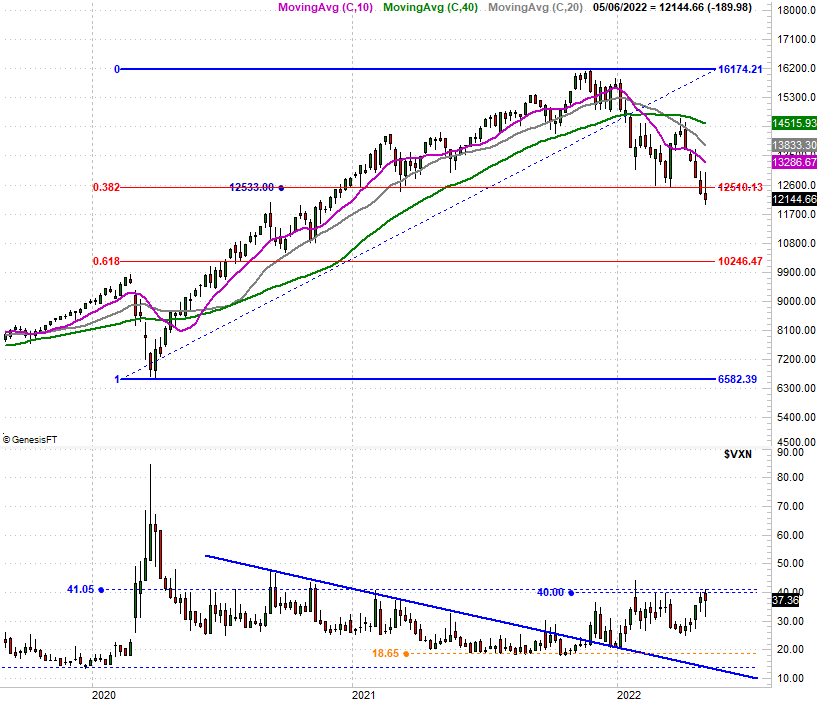
Here's the weekly chart of the NASDAQ Composite for a better feel. The 12,510 level is of course a 38.2% Fibonacci retracement line of the rally from the March-2020 low to last November's peak. Now that it's no longer a floor, it gets much easier for the sellers to drag stocks down to the next key technical floor. That may well be just a little above the 10,000 level. (And yes, we just logged a fifth straight week of losses.)
NASDAQ Composite Weekly Chart, with VXN
 [6]
[6]
Source: TradeNavigator
That's not really the most concerning detail evident on the NASDAQ Composite's weekly chart, however.
We mentioned it in last week's Weekly Market Outlook but it bears repeating now…the volatility index (or VXN) hasn't yet "spiked" higher in a way that suggests fear is peaking. This of course is what you'd expect to see when stocks are making a real bottom, as it happened in March of 2020. The VXN is toying — again — with a ceiling around 40, but it should be pointier and higher to truly call it a capitulation.
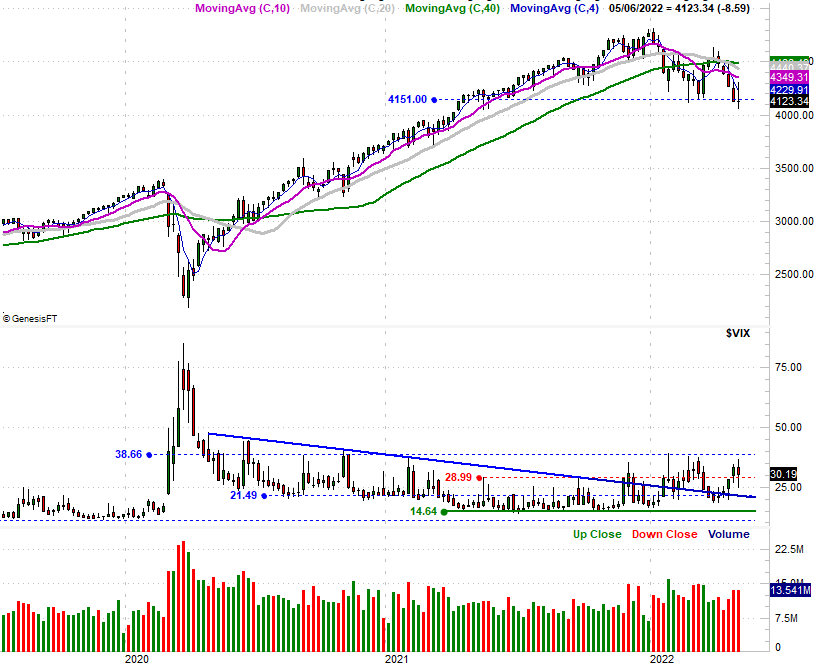
Were it just the NASDAQ's volatility index it might be something we could dismiss. It's not just the VXN though. The S&P 500's volatility index, or VIX, is dishing out the same sort of action. It's not spiking in a way that would suggest a bottom is being made either. In fact, it's not even really testing an interim technical ceiling around 38.6.
S&P 500 Weekly Chart, with VIX and Volume
 [7]
[7]
Source: TradeNavigator
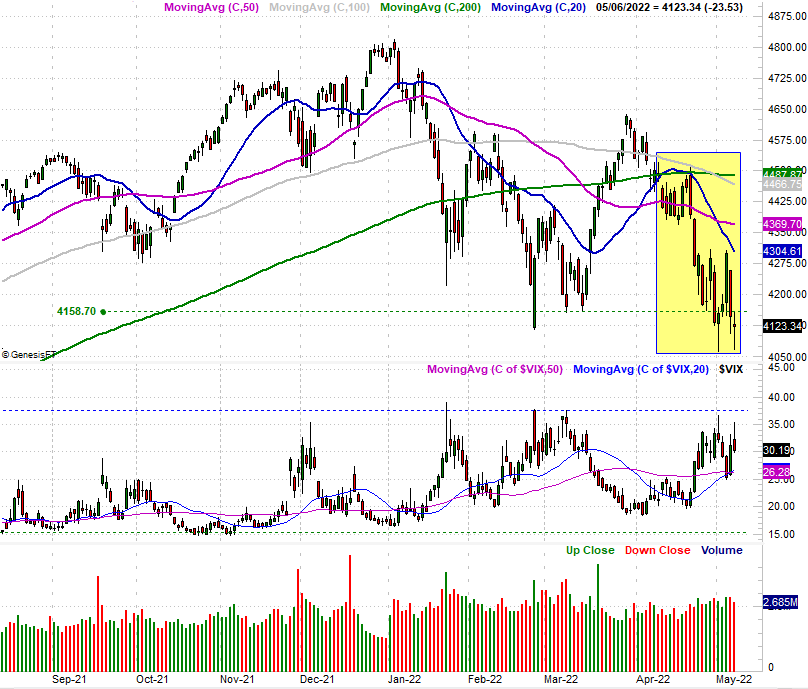
And yes, like the NASDAQ Composites, the S&P 500 broke back under a major technical support level last week as well, at 4160. This is evident on the more detailed daily chart.
S&P 500 Daily Chart, with VIX and Volume
 [8]
[8]
Source: TradeNavigator
There's one curious, non-bearish nuance of the S&P 500 though, as well as the of the NASDAQ Composite (although we don't show it on either of our NASDAQ charts). That is, the volume behind this steep selloff has been surprisingly modest, and even weak, given the depth of the loss. This may or may not be a majority opinion, but rather, just disinterest from the bulls to fend of yet-another wave of profit-taking with the specter of an economic headwind on the horizon.
More downside isn't a foregone conclusion. A couple of companies may post heroic earnings reports early this week and nudge stocks back above these key technical floors, kick-starting a recovery effort.
That's the less likely outcome here, however, with most traders taking a mere lukewarm attitude about everything here, content — for a change — to let the market keep dropping.
As before, both indices will need to crawl back above all of their key moving average lines first before we can seriously entertain the idea of prolonged bullishness. It seems like we're due more downside before we start to see that kind of action.