Weekly Market Outlook - Another Week, Another Win
The market may be due for a correction, but that's certainly not stopping the bulls. It's also not starting the bears. Stocks tacked on another 1.7% last week, moving deeper into record-high territory in the process. Decent earnings news and a positive spin on economic data was all the excuse would-be buyers needed to become actual buyers. Tis the season.
That's something of a problem, of course. While this is the right season for the usual year-end bullishness, things are getting a bit uncomfortable. Stocks are not only overvalued on a look-back basis, but are pretty frothy on a forward-looking basis as well... even factoring in the time needed to fully recover from the COVID lull.
We'll take a closer look at those valuation metrices below. First, let's recap and preview the economic data that's ultimately driving the market to relatively expensive levels (and see if it's still "worth it").
Economic Data Analysis
There wasn't a great deal of economic news from last week to sift through, though what little there was is big stiff, culminating in November's jobs report.
But, first things first - last month's ISM data. Both the services and the manufacturing version of the economic strength measure remained above the critical 50 level. But, both also peeled back from October's levels. It would be far more encouraging to see them each continue to make forward progress.
ISM Services and Manufacturing Index Charts
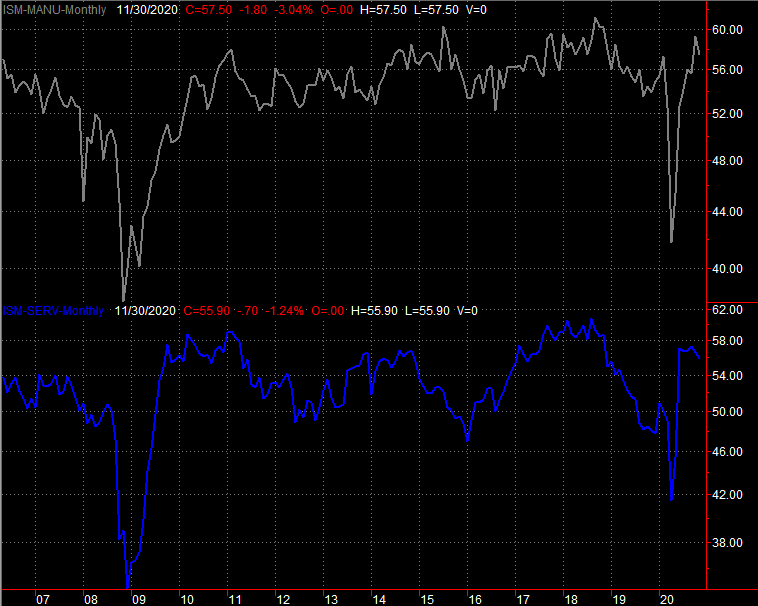
Source: Institute of Supply Management, TradeStation
Auto sales also slumped, though we don't know exactly how much... the final data is still being collected. More on that data set a month from now, when it's back on the economic report calendar.
Last week's big Kahuna was of course was November's jobs report. It wasn't exactly thrilling. Though the unemployment rate fell from 6.9% to 6.7%, that slide is a bit suspicious. The expected payroll growth of 650,000 only came in at 245,000. Although not shown on our chart below, the total number of people now working only grew 160,000 in November, while the size of the official labor force actually contracted. So did the participation rates. We made progress, but it was slight... and the numbers exaggerate the progress.
Unemployment Rate and Payroll Growth Charts
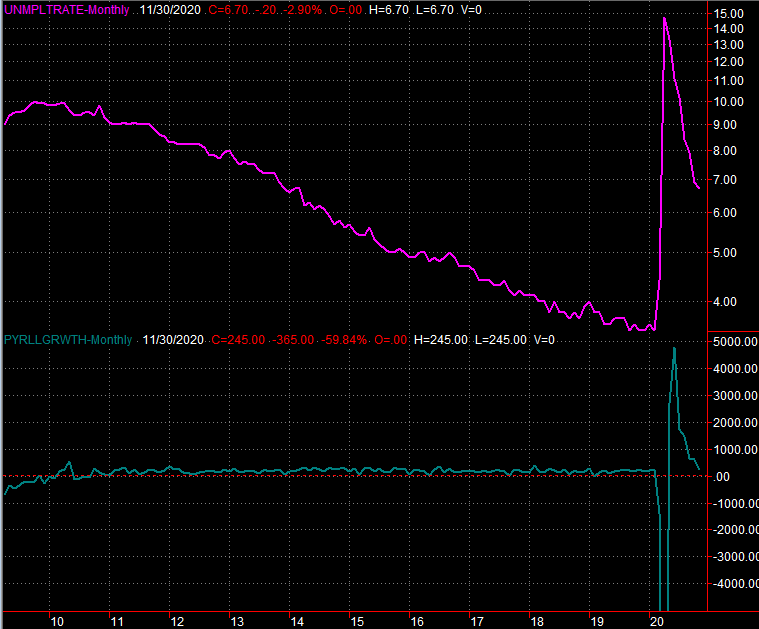
Source: Department of Labor, TradeStation
Everything else is on the grid.
Economic Report Calendar
120620-econ-data
Source: Briefing.com
This week's going to be even lighter. The only news of any interest will be an updated look at the nation's inflation. October's price increases were nil for consumers, and barely higher for producers (factories, assembly plants, etc.). Economists don't think that will be the case this time around, although the outlook for price increases is modest, and healthy, despite what seems to be crimped consumerism.
Consumer, Producer Inflation Rate Charts
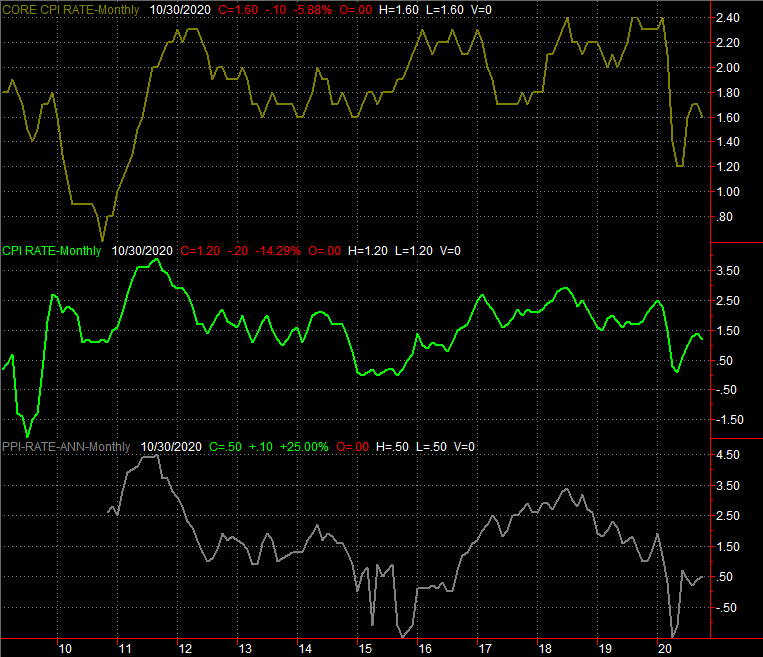
Source: Bureau of Labor Statistics, TradeStation
The overall annualized inflation rate now stands at 1.18%, which is well within the Fed's target range.
Stock Market Index Analysis
In case you're wondering, the S&P 500 is trading at a trailing P/E of just under 30.0, and is valued at a forward-looking P/E of 23.4. The COVID-related economic lull hurt, yet not as much as first feared. Both earnings-based valuation measures are well above average, but consider the circumstances. It could be much, much worse.
S&P 500 vs. Per-Share Earnings, w/Price-Earnings Ratio and Growth Rate
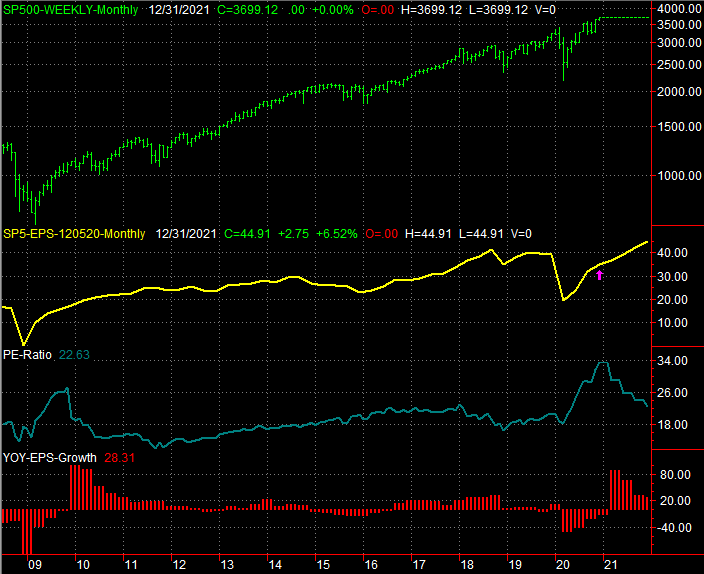
Source: TradeStation, Standard & Poor's
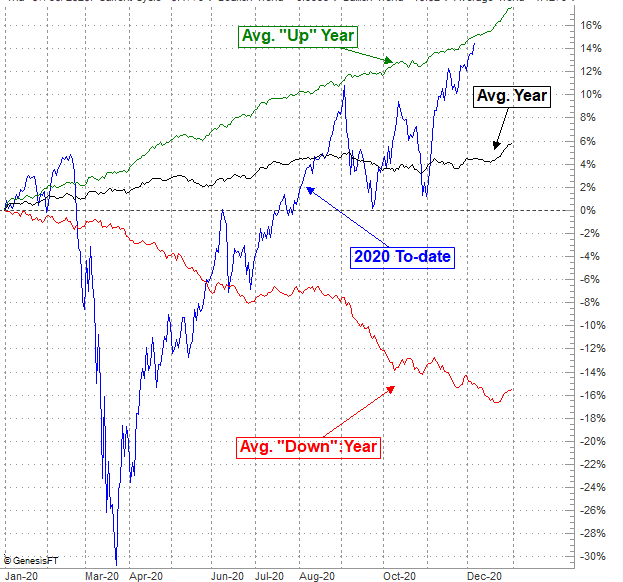
It could also be better though, which adds to the prospect that we'll see some bearish pressure start to take shape here sooner or later. The overbought nature of the index's chart bolsters that possibility. Working in favor of stocks (and against the fundamental-based argument stocks are too high for their own good) is the fact that we're in a time of year that's usually bullish for the market. And, you can also see that this year's net gains aren't particularly unusual even though we're up a little more than 14% year-to-date. In a typical bullish year, the S&P 500 gains almost 18%.
S&P 500 Average Yearly Performance, Day-by-Day
Source: TradeNavigator
And that's what makes analyzing the current daily chart and weekly chart of the S&P 500 so complicated. The factors that aren't evident on the bars aren't factors one can simply ignore.
To this end, notice on the weekly chart of the S&P 500 that the RSI indicator is almost back to the same "overbought" threshold that coincided with September's peak. You can't ell explicitly from the chart, but the index is also now 17% above its 200-day moving average line (green)...which is unusual, and rarely sustained. For perspective, the index only got 16% above that long-term moving average line in September before pulling back.
S&P 500 Weekly Chart, with VIX and RSI

Source: TradeNavigator
Drilling into the daily chart of the S&P 500 doesn't tells us anything more. It just shows us how overextended we've become since the early November bounce; the October pullback never really served as a full "reset" for stocks. Traders were too excited about (1) the calendar, and (2) news about a COVID-19 vaccine. Still, the daily chart does show us the VIX seems to have finding a well-supported floor. It's not going lower, even though the market's going higher. It's a subtle hint that there's not a great deal of confidence in stocks at this lofty level.
S&P 500 Daily Chart, with VIX and Volume
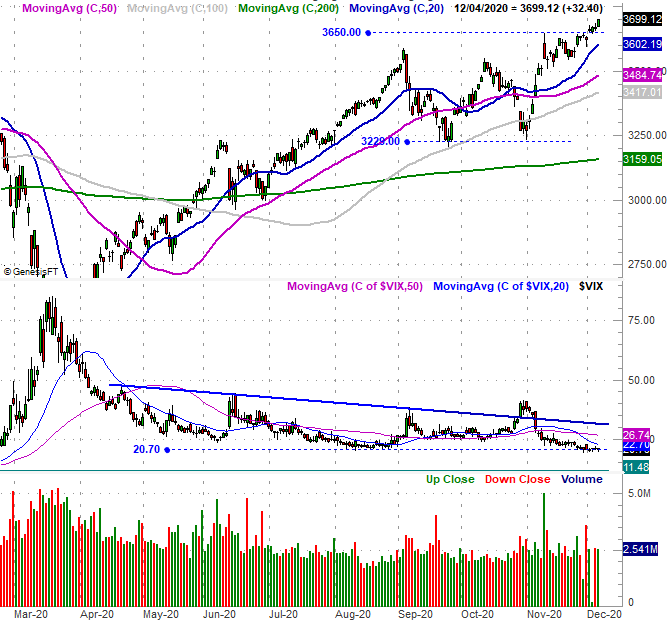
Source: TradeNavigator
The shape/condition of the chart wouldn't normally inspire bullishness. As the old saying goes though, don't fight the tape. The momentum is bullish, and the calendar is helping. That doesn't preclude a pullback in the near future, but until the 100-day moving average line (gray) currently at 3417 fails to hold up as a floor, there's no reason not to assume the rally won't be rekindled.
Make no mistake, however. Stocks are well overbought. We'll have to pay the piper sometime.