
The bulls did all they could last week, but when it was all said and done, they just couldn't get anything going. On the other hand, it's not like the bears fared any better. The market remains on the fence, with optimism aching to keep the rally going, but realism about valuations keeping the lid on any effort to do so. The undertow remains bullish; the rally just took a breather.
Still, we're right back to a situation where the level of complacency is dangerous. And, we're also at a time of year (overdue, actually) when we'd expect a sizeable pullback to set up the usual fourth quarter rally. That schedule is off-kilter now, leaving traders wondering what's in store after ten months of mostly-uninterrupted rally.
We'll weigh it all after a run-down of last week's economic reports and a preview of this week's economic news.
Economic Data
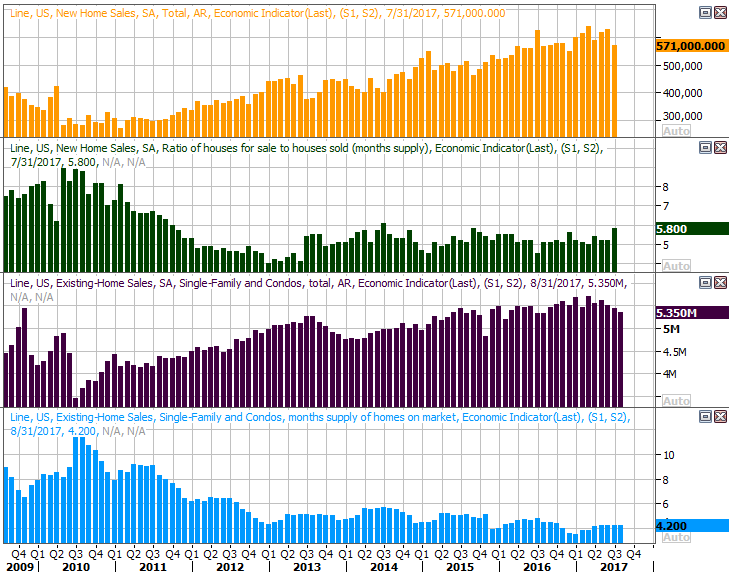
There wasn't a whole lot on the economic dance card for last week, though it was a huge week for real estate, starting with housing starts and building permits. Both were better than expected. More than that though, the uptick in permits breathes new life into a waning chart.
Housing Starts and Building Permits Charts
 [1]
[1]
Source: Thomson Reuters Eikon
It's likely starts lulled last month because no builder wanted to start a new home in late August all around the Gulf Coast area, as it would likely suffer damage. That lull could be offset this month.
Though we won't get August's new home sales figures until this week, we got last month's existing home sales data last week. In that these two figures go hand in hand though, we'll plot them on the same chart and give you the new-home sales preview up here rather than down below.
And, last month's existing home sales were just so-so, rolling in at a pace of 5.35 million versus expectations of 5.44 million; it's likely that hurricane Harvey kept at least some would-be buyers focused on other things. Still, the trend was pointed lower even before last month's report.
New and Existing Home Sales Charts
 [2]
[2]
Source: Thomson Reuters Eikon
This week we're expecting to hear that new homes sold at an annualized pace of 577,000 units, slightly up from July's rate of 571,000. Then again, that bar's pretty low.
Notice that inventory levels are — or were, anyway — holding steady or maybe even improving. Some had suggested a lack of inventory was holding home sales back, but we're not so sure. We've got a feeling inventory is starting to grow because demand is falling.
It's anyone's guess as to how these numbers will shake out the next time we hear them — the two hurricanes can work for, and against, home sales.
Of course, last week's biggest economic news came from the Federal Reserve; it decided not to impose a rate hike even though it had a chance to. But, Janet Yellen did more or less suggest there will be one in December rather than in March, as had been previously assumed. Though inflation is hardly rampant yet, she and the FOMC see enough budding inflation — stemming from the hurricane rebuilding effort — on the horizon to take action sooner than later.
Everything else is on the grid.
Economic Calendar
 [3]
[3]
Source: Briefing.com
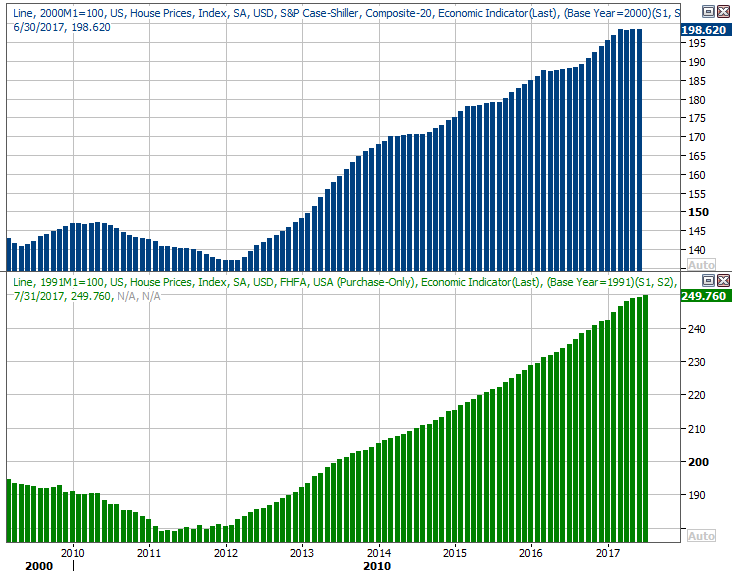
This week we'll hear about home prices via the Case-Shiller Index, rounding out the FHFA Housing Price Index update for July we got last week. The FHFA said prices were up 0.2% month-to-month in July, which compares equitably to the 5.8% year-over-year increase we're projected to hear on Tuesday for July.
Home Price Charts
 [4]
[4]
Source: Thomson Reuters Eikon
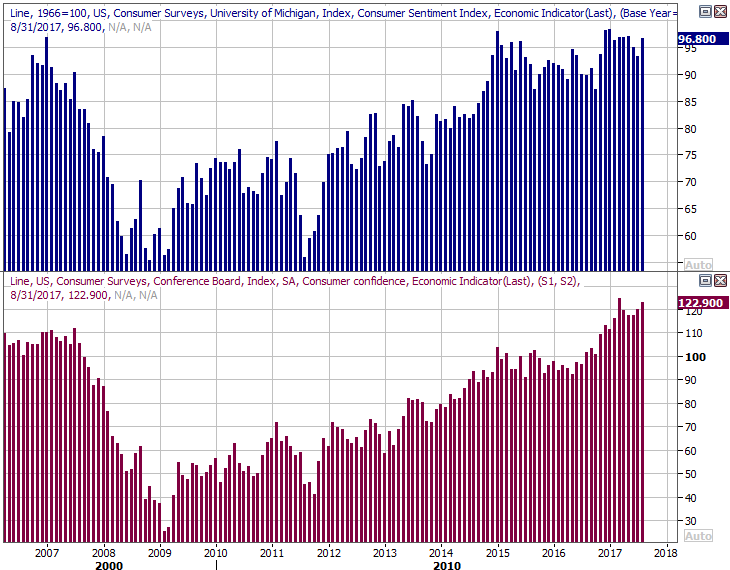
Finally, this week is going to round out the average consumer's view of things right now, with the third and final update of the Michigan Sentiment Index due on Friday, and with the first and only look at the Conference Board's consumer confidence score for September. Both continue to edge higher, fanning the market's bullish flames even when it seems like things shouldn't be tacking on more gains.
Consumer Sentiment Charts
 [5]
[5]
Source: Thomson Reuters Eikon
Also notice we'll be getting a third and final reading on Q2's GDP growth rate, though don't look for a change from the second estimate of 3.0%.
Index Analysis
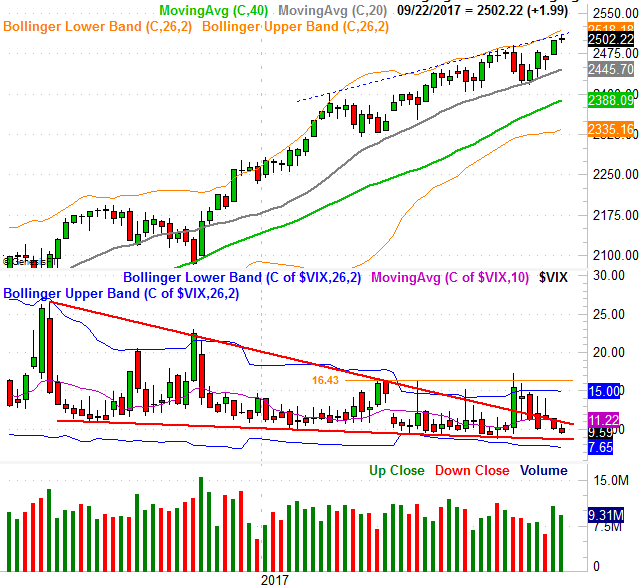
How does the old saying go? A picture is worth a thousand words? If that's the case (and it usually is), let's just start this analysis with a look at the daily chart of the S&P 500. In retrospect, we've just been through an all-too-familiar rise and the beginning of a subsequent fall for the index. If the pattern repeats itself, the index should be back around 2440 — give or take — within a few days. After that, the bulls may well do the same thing they've done for months now… refuse to not rekindle the rally.
S&P 500 Daily Chart
 [6]
[6]
Source: TradeNavigator
Zooming out to a weekly chart of the S&P 500 doesn't tell us anything new, but it does put the past few weeks into perspective. We've gone a very long time without even a minor correction. It's also on the weekly chart we can see just how uncomfortably low the VIX has gotten.
S&P 500 Weekly Chart
 [7]
[7]
Source: TradeNavigator
Let's also not overlook the fact that the shape of last week's bar for the S&P 500 was a doji (albeit a short one), further suggesting a pivot from bullishness to bearishness could be in store. It sure would make sense in light of the calendar. September is "supposed to be" a bearish month, setting the stage for a fourth quarter rally that starts to materialize around mid-October. Yet, it's been wrong to bet on a major pullback since last October.
And there's the rub…. no specific technical reason to assume the bullish momentum isn't intact, but a dozen or so reasons to suspect the rally is about to unravel.
We'll continue to do what we've had to do for weeks now, which is take it day by day rather than make any major assumptions. There are a couple of major things we'll be looking for — and at — though.
One of them is the VIX. The "too low" argument is admittedly getting a little old and tired now, though it's not something to simply dismiss. Though it's failed to move above 16.4 of late despite a few tries, if and when that finally does happen, that very likely will be the big correction that's long overdue.
We're also going to keep a close watch on the S&P 500's 100-day moving average line (gray, on the weekly chart), which has become something of a technical floor in itself since April. If the index breaks under that level, it could finally start a selling avalanche.
Those are a couple of big "ifs," however.
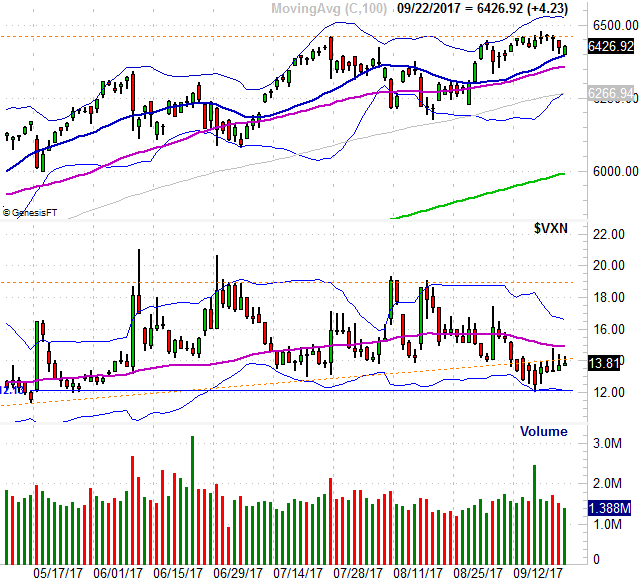
A look at the daily chart of the NASDAQ Composite doesn't help much, though there is one noteworthy thing about it. That is, while for a little while early last week it looked like the composite was going to convincingly break past the prior peak around 6461 (from July). It didn't though. It peeled back after attacking it.
NASDAQ Composite Daily Chart
 [8]
[8]
Source: TradeNavigator
Notice how the NASDAQ never saw the growth in bullish volume it needed to achieve escape velocity… one of the key reasons most of the other breakout attempts fizzled early one. (Of course, the long-term rally is still intact.)
Whatever the case, the 100-day moving average line (gray) is a make-or-break mark for the NASDAQ as well, and the VXN's ceiling at 19.0 is the key to turning a small pullback into a full-blown correction.
The market is still very much on the fence in the meantime.