Stocks logged a second consecutive winning week, and a second straight record weekly close, though the bulls ended the week with anything but enthusiasm.
Then again, they didn't need to finish the trading week on a high note to do some real damage. Last week's last trade for the S&P 500 was almost 0.9% better than the previous week's close… not bad given the time of year, and how overextended the market is at this point.
We'll weigh the odds of more upside in our usual analysis below, right after a review of last week's economic news and a preview of this week's announcements.
Economic Data
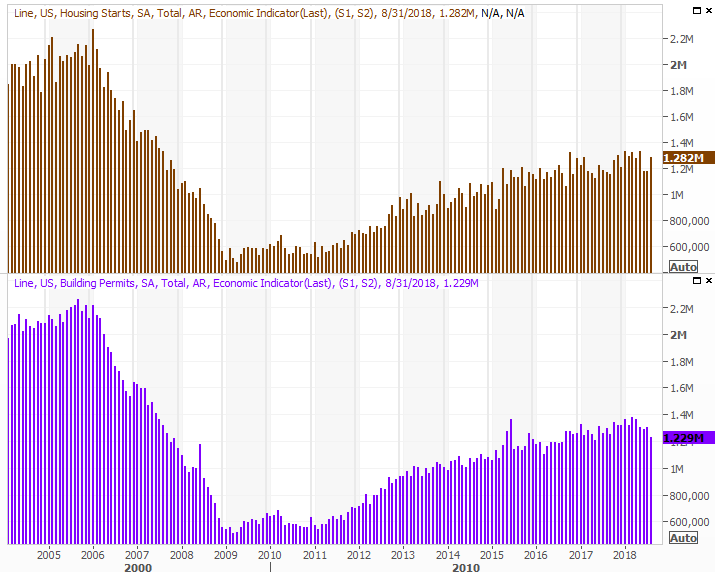
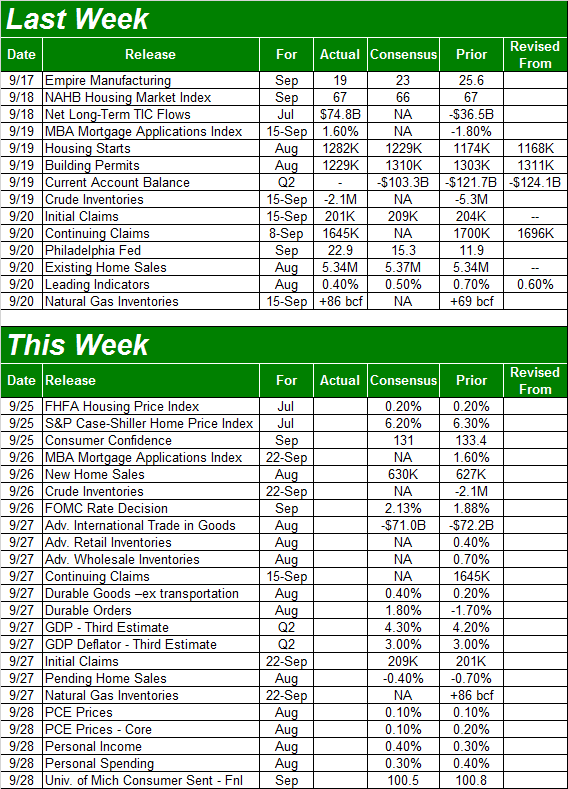
This week's biggie was a look at August's housing starts and building permits. The data was, in sum, just ok. Starts were up a bit and much better than expected, while permits fell quite a bit and rolled in much lower than expected. This sliver of the market just couldn't afford another so-so reading though. Construction has been a soft spot for a while, and it seems to be worsening.
Housing Starts and Building Permits Charts
 [1]
[1]
Source: Thomson Reuters
So far the lull hasn't been infectious. Home prices are still firm, and rising, and it's not as if consumers aren't spending in all other ways. For whatever reason though, homes aren't of as much interest. Real estate may have priced itself out of the market, or it could be that consumers are simply content where they are.
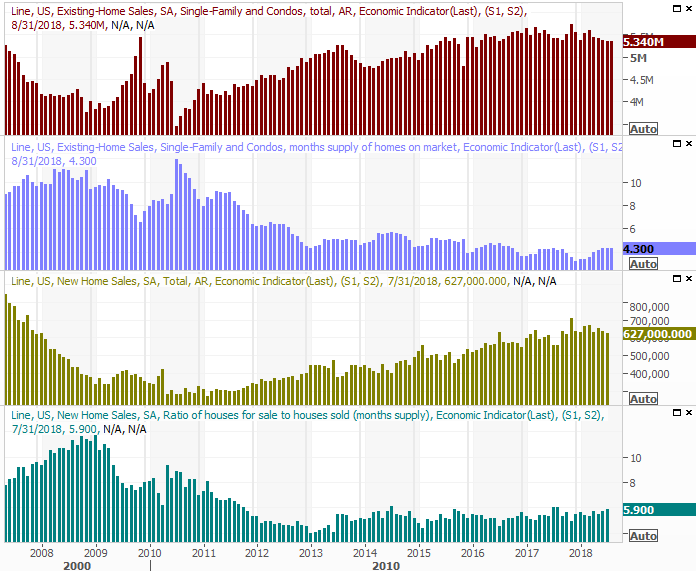
This week's new-home sales data will tell us more about that, but if last week's existing-home sales report is any indication, investors can't hold their breath waiting on clarity. Existing home sales were transacted at an annual pace of 5.34 million last month, matching July's pace.
New and Existing Home Sales Charts
 [2]
[2]
Source: Thomson Reuters
For what it's worth, last month's leading indicators were up 0.4%. Everything else is on the grid.
Economic Calendar
 [3]
[3]
Source: Briefing.com
This week's economic dance-card is pretty full, but not a great deal of it will be earth-shattering news.
The party starts on Tuesday with July's FHFA Housing Price Index report… the same day the S&P Case-Shiller Price Index for July will be published. Both have been trending higher for years now, and the pros say both should continue on. This is a big hint that the housing market may not be as week as it seems given the starts and permits and sales-transactions data.
Home Sales, Inventory Charts
[2]
Source: Thomson Reuters
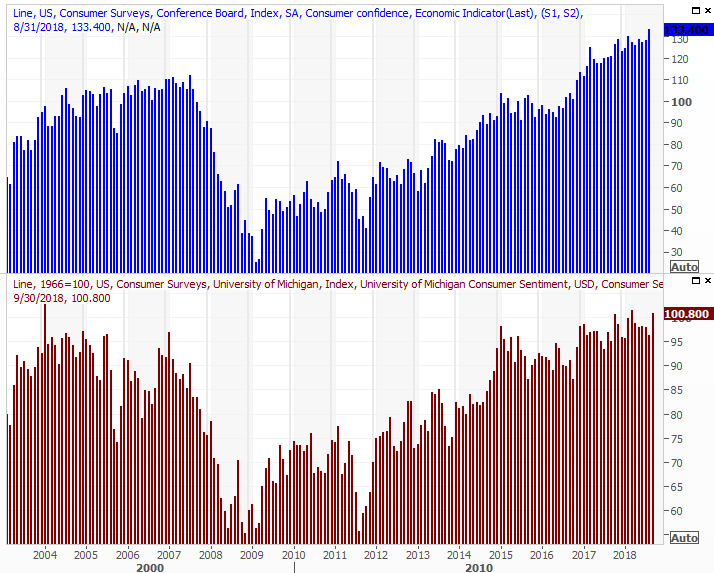
It's also going to be a big week for consumer sentiment measures. The Conference Board's consumer confidence reading will be posted on Tuesday, while the University of Michigan's third and final look at consumer sentiment for September will be posted on Friday. Both remain in overall uptrends, even if they're not straight-line trends.
Consumer Sentiment Charts
 [4]
[4]
Source: Thomson Reuters
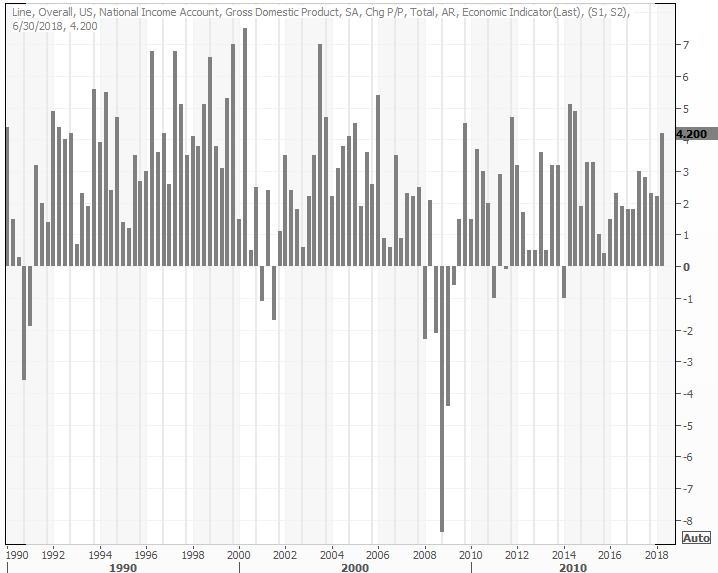
On Thursday keep your eyes peeled and your ears open for Q2's third and final GDP growth estimate. As of the last look it was a healthy, and it generally doesn't change from the second to third reading.
GDP Growth Charts
 [5]
[5]
Source: Thomson Reuters
This week's biggest news, of course, will be Wednesday's interest rate decision from the Federal Reserve.
It's a tricky situation to be sure. Inflation is clearly in place, but a closer look at the matter reveals the pace of inflation is slowing. Economic growth is strong, but it's not clear how fragile that growth may be. As of the latest look the market is saying there's a 94% chance the Fed Funds target rate will be between 2.0% and 2.25% after the FOMC makes its call, implying a quarter point hike is going to be imposed. It remains to be seen if the market will view that as a liability or a sign of confidence.
Index Analysis
In case you were wondering, Friday's volume surge wasn't a complete surprise, and there's not a lot of hidden meaning behind it. It was a triple-witching day, when a whole slew of futures and options expired, forcing people to make more buy and sell decisions than they normally might.
Nevertheless, where we start this week is where we left off last week. And where we left off last week was with traders still in a dangerously bullish mood. Yet, we can also say there's something of a growing preference for safety, and a growing effort to steer clear of aggressive growth. The blue-chip-heavy Dows Jones Industrial Index did considerably better than the S&P 500 and the NASDAQ Composite did.
A trend isn't made or broken in one day though.
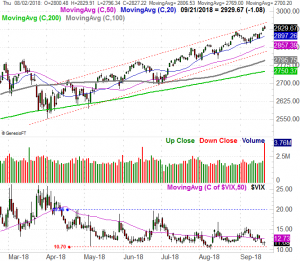
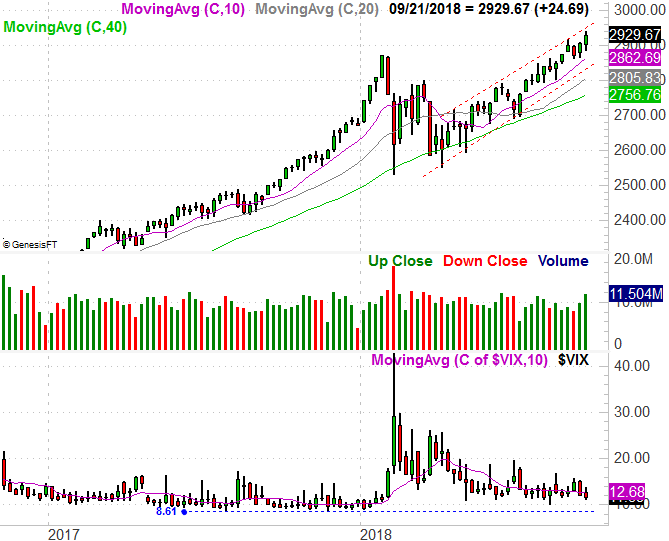
Whatever the case, the S&P 500 remains in an uptrend framed by rather well-defined support and resistance lines, but the index is at the upper end of that range now. If history repeats itself, at the very least the market will slow down here, if not stage a full-blown pullback. Adding to the market's burden here is the calendar; September is usually a loser for stocks.
S&P 500 Daily Chart, with VIX and Volume
 [6]
[6]
Source: TradeNavigator
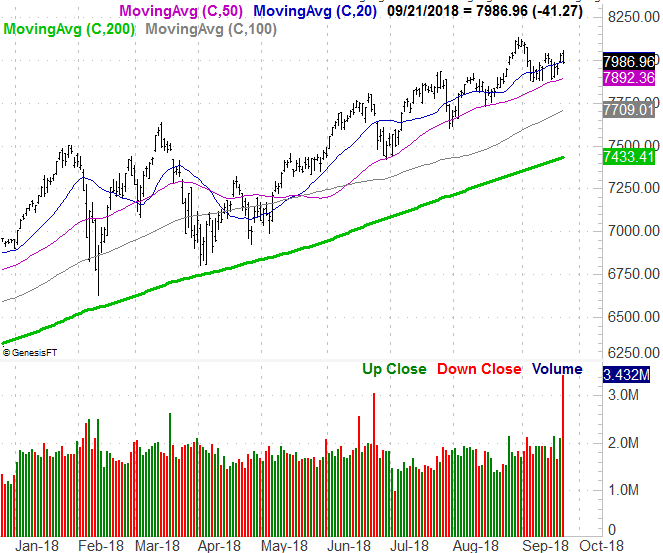
Zooming out to a weekly chart of the S&P 500 puts things in better perspective. The market's capable of sustaining this sort of overheated rally, but not forever. For the record, the S&P 500 didn't melt down in February until it was 13% above the 200-day moving average line (green). The index is only 6.2% above its 200-day line now. And, though it's looking to test the floor, the VIX is not yet to its absolute floor around 8.6.
S&P 500 Weekly Chart, with Volume
 [7]
[7]
Source: TradeNavigator
Just for the sake of continuity, a look at the daily chart of the NASDAQ Composite as of Friday.
NASDAQ Composite Daily Chart, with Volume
 [8]
[8]
Source: TradeStation
If it seems like the tech-heavy NASDAQ has been lagging of late, you're not imagining things. It's underperformed since the end of last month. And, that's a problem. The composite tends to lead the rest of the market, up or down. If it's persistently lagging, it may well underscore something suggested above… investors may have already mentally mapped out weakness.
We're certainly not in that sort of trouble yet… not even close, in fact. The market could peel back a pretty good amount and the broader uptrend would still be intact. For the S&P 500 the floor is the lower boundary of its rising trading range, currently at 2830 and rising fast. And, really, the 200-day moving average line at 2750 (and also rising fast) would need to be snapped to really worry. A breakdown of that magnitude seems unlikely, even if late-September sours. Stocks generally rally between mid-October and the end of the year.
On the other hand, it seems unlikely there's a great deal of upside – if any – left ahead for the S&P 500.
As for the NASDAQ Composite, its 50-day moving average line at 7892 (purple) is the most plausible near-term support, though it's the 200-day line at 7433 that could kick-start a bigger breakdown… or fuel a bounce. Somehow it seems like the NASDAQ also doesn't have a whole lot of gas left in the tank either, and needs to go through a correction again just to 'clear the decks.'
With all of that being said, it would be naive to think that the Fed's stance on interest rates or news on the tariff war front couldn't obliterate any reasonable interpretation or outlook. Keep your head on a swivel.