
Another week, another win, with this one being even bigger than the last. The S&P 500 rallied 2.0% from the previous week's close, versus that week's 1.3% advance. Of course, the big move carried the market a little deeper into record-high territory, logging the fifth consecutive weekly gain. The momentum looks rock-solid.
And, maybe it is. There's a major problem with the rally as Friday's action though. It just bumped into a major technical resistance line. Friday's intraday rollover only bolsters the suspicion that stocks may have just topped out… at least in a small way.
We'll look at this action in some detail below. First, let's recap last week's economic news and preview what's coming this week. We wrapped up this most recent week with a solid jobs report, but there was clear lack of follow-through on the knee-jerk buying effort. Maybe it was just a tough day, but maybe it was an "as good as it gets/sell the news" kind of event instead.
Economic Data Analysis
The U.S. economy added 531,000 new jobs last month, topping estimates for payroll growth of 400,000. Less touted is the fact that September's first job-growth estimate of 194,000 was revised upward, to 312,000. It was enough to pull the unemployment rate down from 4.8% to 4.6%, and below estimates of 4.7%. Joblessness is still a challenge, but there's no denying it was a great jobs report from the Department of Labor.
Unemployment Rate and Payroll Growth Charts
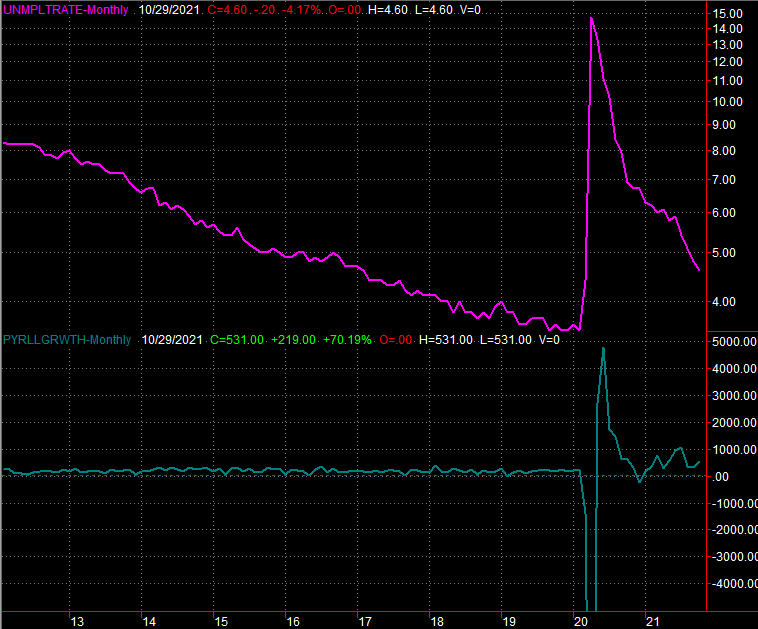 [1]
[1]
Source: Institute of Department of Labor, TradeStation
Still, the Federal Reserve didn't see enough economic strength — despite painful inflation — to raise interest rates when it had a chance to do so last week; the Fed Funds rate still stands at 0.13%. On the other hand, the FOMC reminded us last week that there's enough economic firmness to follow-through with previously-announced plans to curtail its bond-buying activities. That is in some regards de-stimulative.
The only other data set revealed last week that's worth noting is the Institute of Supply Management's key indices. The ISM Manufacturing Index cooled a little, but at 60.8 it's still plenty firm. Meanwhile, ISM Services Index blew away expectations by soaring to a record-high reading of 66.7.
ISM Manufacturing and Service Index Charts
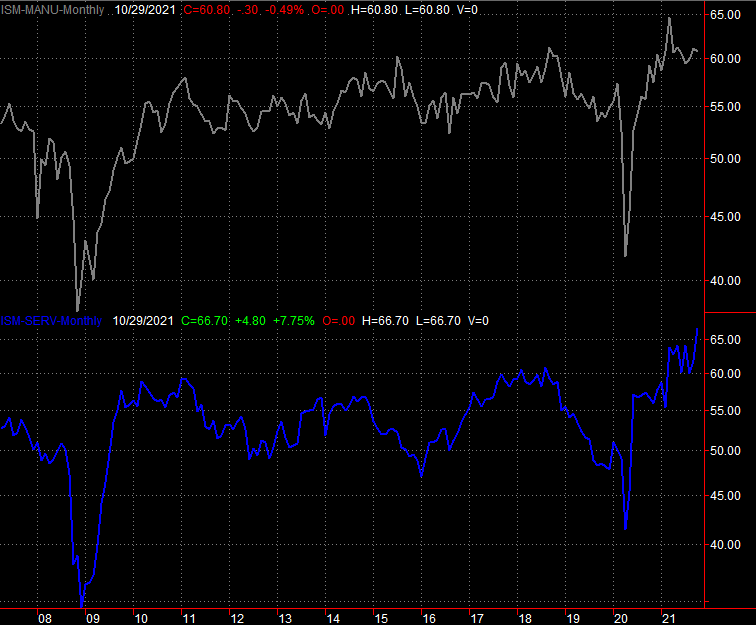 [2]
[2]
Source: Institute of Supply Management, TradeStation
Everything else is on the grid.
Economic Calendar
 [3]
[3]
Source: Briefing.com
This week isn't a particularly busy one, but it is a big one. The Bureau of Labor Statistics will announce October's producer inflation rates on Tuesday, followed by the more closely-watched consumer inflation data on Wednesday. Economists aren't looking for any relief from recent price discomfort. In fact, they're bracing for an uptick inflation no matter which basket of goods and services you're looking at.
Inflation Rate (Annualized) Charts
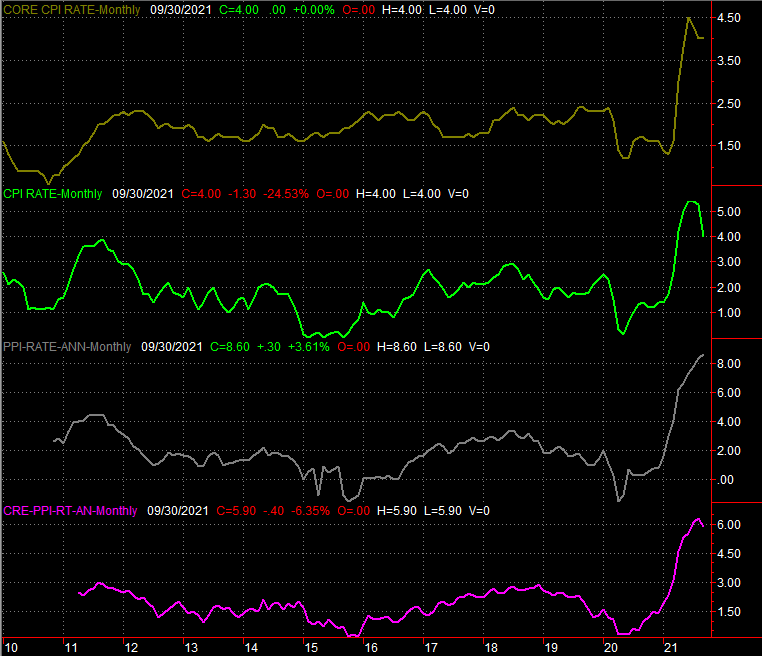 [4]
[4]
Source: Bureau of Labor Statistics, TradeStation
The current core consumer inflation rate currently stands at 4.0%, but is a frothy 5.4% when factoring in food and gas.
Stock Market Index Analysis
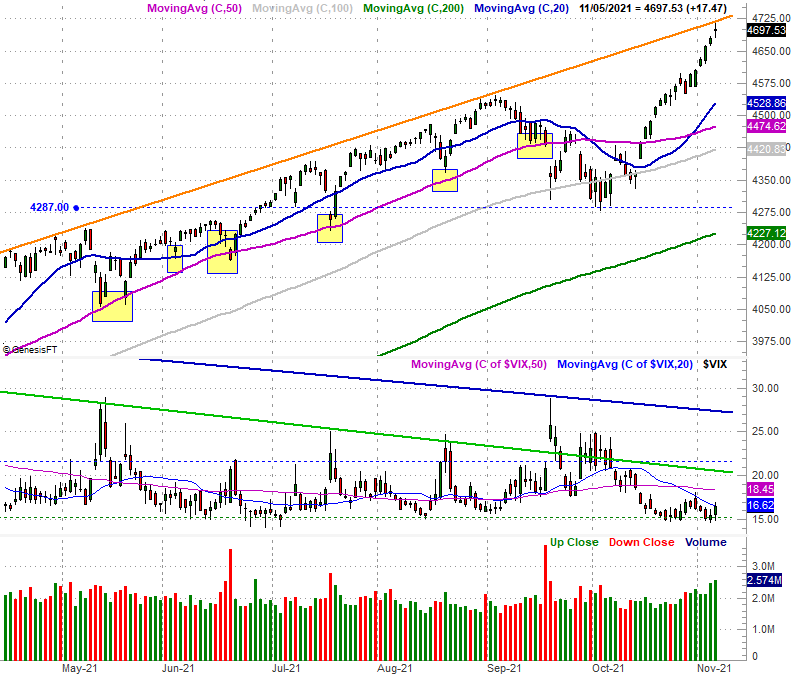
With nothing more than a quick glance the market looks like it's still in "full steam ahead" mode. We ended last week on a high note thanks to firm jobs numbers from the Department of Labor, and stocks finished up another bullish week with a Friday gain.
There are some red flags waving though, like where Friday's high materialized right before a modest pullback, and the shapes of Friday's bars themselves.
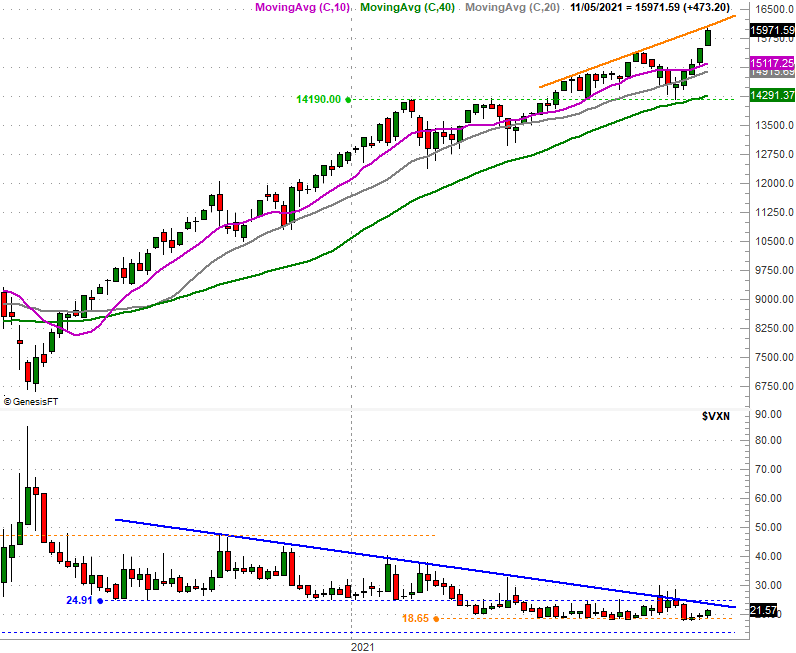
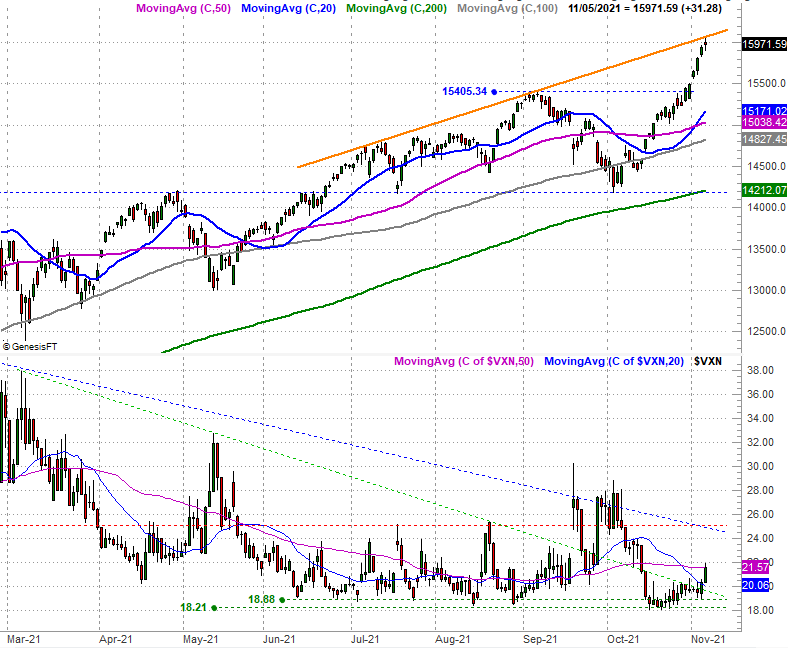
The first of these worries is most evident on the weekly chart of the S&P 500. Take a look. The advance stopped right at the same line (orange) that connects all the key highs going all the way back to September of last year.
S&P 500 Weekly Chart, with VIX and Volume
 [5]
[5]
Source: TradeNavigator
The NASDAQ Composite's weekly chart looks similar, though not identical. The big difference here is, the NASDAQ's technical ceiling (orange) only connects the key highs made since July of this year. It's still a huge ceiling though, made even bigger by the fact that the NASDAQ's 10% rally over the course of the past five weeks is the most bullish five-week span seen since the initial March/April-2020 recovery move. The "too much, too fast" argument isn't a crazy one to make here.
NASDAQ Composite Weekly Chart, with VXN
 [6]
[6]
Source: TradeNavigator
Drilling into the daily charts of both indices reveals another key detail that (loosely) suggests a market top may have just been made. On the daily chart of the S&P 500, for instance, Friday's open and close were not only right at the same level, but right in the middle of the day's bar (the high-to-low range). This is called a doji, and often indicates the point of equilibrium when transitioning from a net-bullish to a net-bearish environment. In other words, Friday could be the pivot point for the market.
S&P 500 Daily Chart, with VIX and Volume
 [7]
[7]
Source: TradeNavigator
The NASDAQ Composite's daily bar from Friday drops the same hint. That it, it's a doji, and after such a big runup, a swing into a profit-taking headwind feels likely here.
NASDAQ Composite Daily Chart, with VXN
 [8]
[8]
Source: TradeNavigator
Also notice on both charts that the volatility indices — the VIX and the VXN — are starting to edge upward, although neither has punched through their most critical technical ceilings.
Only time will tell if we're moving into correction mode… although not much time. Both the bulls and the bears are at a major inflection point as of Friday. They'll both need to make a decision about what lied ahead pretty early this week, in fact, though don't be surprised if they take a day or two to decide.
Even if stocks start to slide lower though, don't panic, and don't jump to decidedly bigger-picture bearish conclusions. There's lots of room to peel back without actually breaking below a major support level. And, there's lots of support levels below. Both indices currently sit above all of their key moving average lines. As long as they remain below the indices and the volatility indices remain under their biggest technical ceilings (dashed), the longer-term rally remains intact.