The broad market technically ended the week in the red, but just barely. The S&P 500 gave up 0.12% of its value last week thanks to Friday's bullishness, and perhaps more important, ended the week on a high note that could set the tone for the start of this week. Nevertheless, challenges linger ahead. Stocks remain overbought, overextended, and arguably overvalued, and the advances we saw last week weren't exactly high volume affairs. We'll see.
Before we dissect anything related to the shorter-term outlook for the market though, let's look at the economic drivers of its long-term trend. Last week was light, but this week's going to be a pretty busy one.
Economic Data Analysis
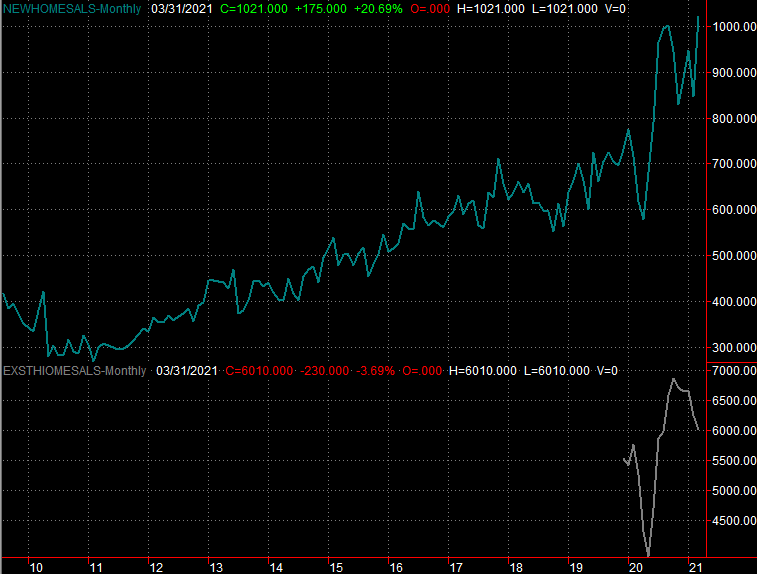
The only news of any real interest from last week as March's new and existing home sales, further fleshing out this month's look at the real estate sliver of the economy. It was a good news/bad news situation. Sales of new homes surged to an annualized pace of 1.02 million, which is the best reading since 2006. Sales of homes already built and previously lived in, however, slumped from a rate of 6.24 million per year to a multi-month low of 6.01 million.
New, Existing Home Sales Charts
 [1]
[1]
Source: Census Bureau, National Association of Realtors, TradeStation
That bad news, however, is still actually good news. The slowdown in existing home sales is largely the result of a lack of inventory that's pushing homebuyers toward new homes… if they can find one. Available inventory is only enough to supply the market for 2.1 months at its current pace of purchases, with only about 1.1 million homes actually "on the market." That's still near the lowest levels seen in months, up slightly from the lowest lows seen in January.
Everything else is on the grid.
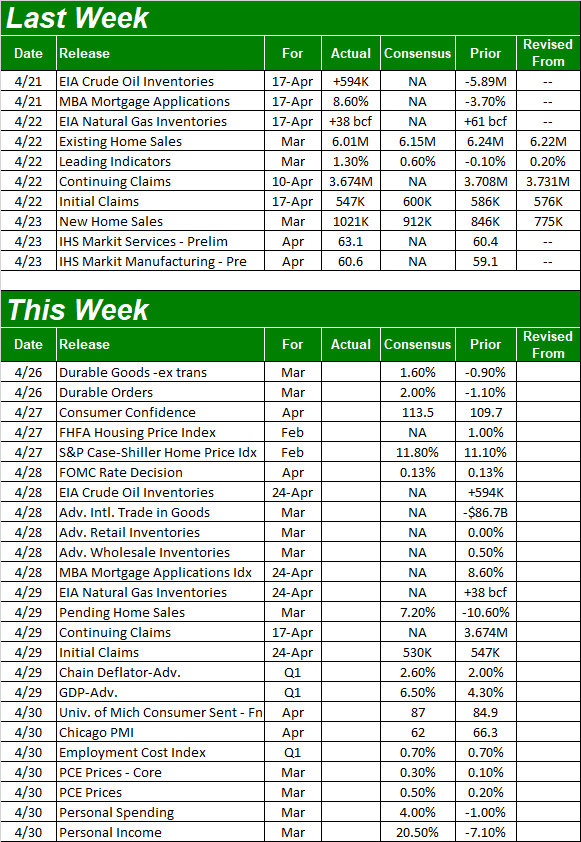
Economic Report Calendar
 [2]
[2]
Source: Briefing.com
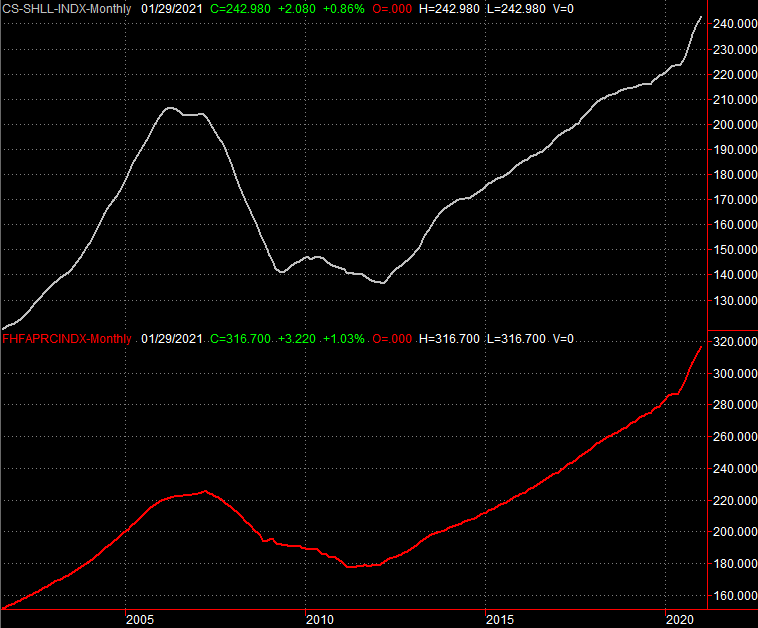
The real estate picture gets rounded out this week with Tuesday's updates of the Case-Shiller Home Price Index and the FHFA Housing Price Index. Both are projected to rise, again. Do note that these newest figures will still only be for February, but the trend is the key. And, given the other real estate data we've gotten this month, there's no reason to think prices aren't firmly up again for March and April.
Case-Shiller, FHFA Housing Price Index Charts
 [3]
[3]
Source: Standard & Poor's, FHFA, TradeStation
Also note this is a big week for consumer confidence, with the Conference Board's look at consumer confidence for March coming on Tuesday, followed by the third and final update of the University of Michigan Consumer Sentiment reading on Friday. Look for both to be up again, moving back to their best levels since the pandemic first took hold.
Consumer Sentiment Charts
 [4]
[4]
Source: University of Michigan, Conference Board, TradeStation
Perhaps the biggest two items in the queue this week, however, are Wednesday's decision from the Federal Reserve regarding interest rates, and Thursday's first look at Q1's GDP growth. As of the latest look economists and traders aren't counting on a rate hike, though truth be told, if inflation continues to hint at swelling, one might be in the cards in the foreseeable future. As for GDP, as strong as Q4's 4.3% growth was, economists currently believe that growth accelerated to 6.5% during Q1. Just consider the circumstances. We're still not quite back to pre-pandemic levels of economic activity.
Stock Market Index Analysis
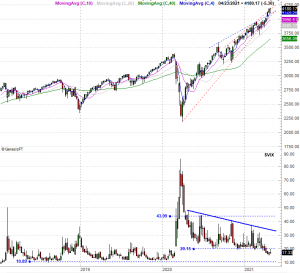
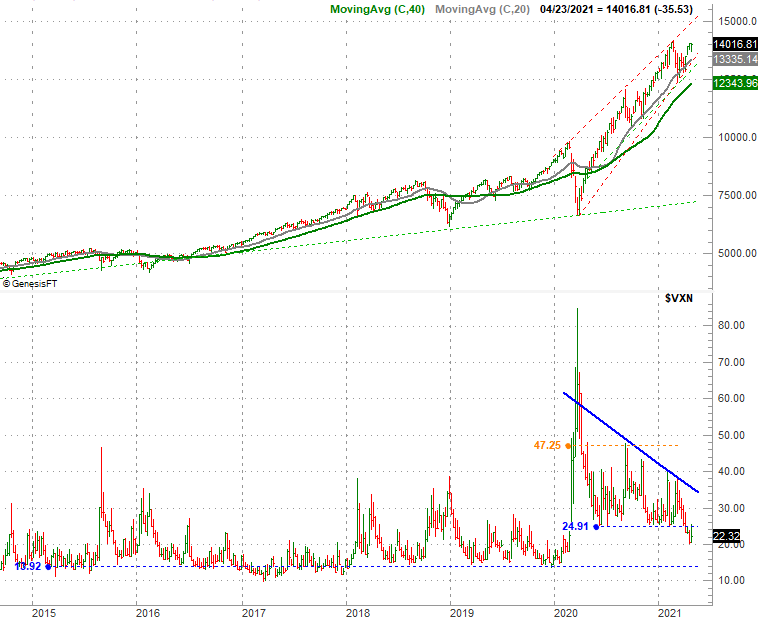
Where do we begin? How about with a long-distance view of the NASDAQ Composite's daily chart, since it shows us most of what we want to know right now. With nothing more than a passing glance we can see that the index is still within the confines of a rising bullish channel (framed by red dashed lines), and currently moving from the lower edge of that channel toward the upper boundary thanks to strong support offered by the 100-day moving average line (gray) back in March (highlighted). There's still room to keep rising before the upper edge of the trading range is bumped.
NASDAQ Composite Daily Chart, with VXN
 [5]
[5]
Source: TradeNavigator
Also notice that when the NASDAQ's Volatility Index, or VXN, tried to reverse higher last week that it was held back by its 20-day moving average line (blue). While being this low leaves it ripe for a reversal, that's not happening quite yet.
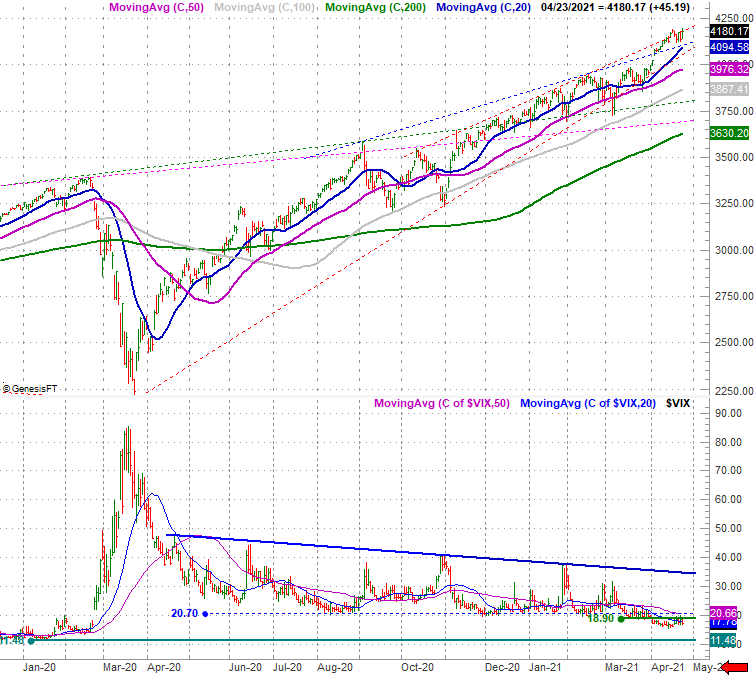
The impasse is that the S&P 500 doesn't have this same amount of room to run. It's at all-time highs as of last week, already thrusting into a technical ceiling that connects all the key highs since October.
S&P 500 Daily Chart, with VIX
 [6]
[6]
Source: TradeNavigator
Although not shown, the Dow Jones Industrial Average is also currently bumping into a long-established technical ceiling, having hit record highs just a few days ago.
Zooming out to a weekly chart of either index doesn't help a whole lot, other than to put the past thirteen months in perspective. It's here we can get a grip on the scope of the S&P 500's 91% runup from last March's low…
S&P 500 Weekly Chart, with VIX
 [7]
[7]
Source: TradeNavigator
…as well as the NASDAQ Composite's big move. It's up 11% for the past thirteen months even if it's not yet back to February's record highs.
NASDAQ Composite Weekly Chart, with VXN
 [8]
[8]
Source: TradeNavigator
While the pandemic-prompted selloffs in February and March cut deep, the bulls have more than corrected the stumbles in the meantime. Indeed, they've dramatically over-corrected the pullbacks, leaving stocks at overbought and overvalued levels that beg for a corrective move.
Except, this is nothing new. A corrective move has been overdue for months, yet it never takes shape. Stocks keep marching on, driven more by trader euphoria and the fear of missing out (or FOMO) than actual fundamentals. Problem is, this particular wave of FOMO is so strong that it's become impervious to challenges. That is to say, the biggest reason the market is going higher is because it's going higher.
That condition won't last forever. There's coming a time when trader psyches will be vulnerable to the right selling stimulus, and any new bullishness tacked on between now and then only gives the market further to fall. Until that happens though, the trend is clearly pointed upward.
The good news is, there are some clear signals that just might tell us if-and-when the tide is turning.
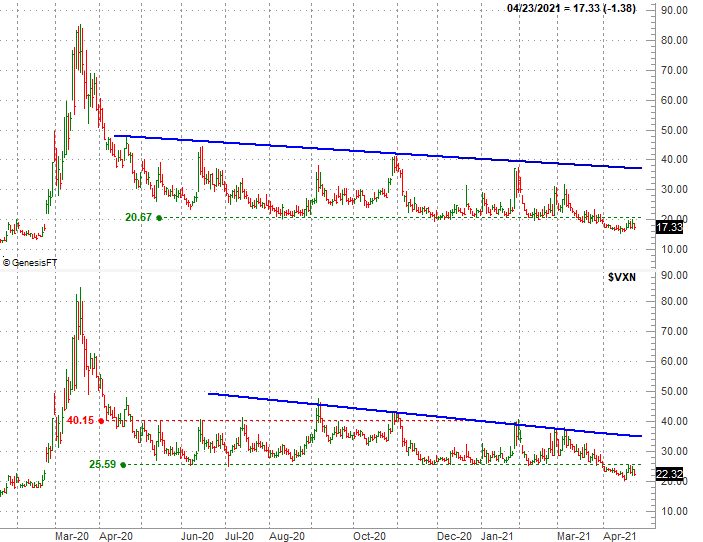
Look back to the volatility indices for the NASDAQ and S&P 500. They both dished major wins for the bulls last week by virtue of their encounter with what used to be technical floors (green, dashed) but have since turned into technical ceilings. While this doesn't speak to when either volatility index might punch above these resistance levels, at least we know where to look; floors-turned-into-ceilings are sort of a big deal.
NASDAQ Composite and S&P 500 Volatility Index Daily Charts
 [9]
[9]
Source: TradeNavigator
The real game-changers for the volatility indices, however, are the resistance line that connect most of the peaks going back to the middle of last year (blue). At this point only a move above those ceilings would signal a major shift in sentiment. And most likely, such an event would coincide with the market indices breaking under key support levels like the 100-day moving average lines.
This of course leaves some room for small pullbacks. Don't confuse them with the beginnings of a major correction though. The bigger trend is still bullish, as unlikely as that may seem thirteen months into huge, unfettered rallies.