The market may have ended last week on a high note, but it still ended the week in the red… for the sixth week in a row. The S&P 500 is now down 13.2% from March's high. And, despite the flash of bullish brilliance seen on Friday, most of it can be chalked up as a knee-jerk response to Wednesday's and Thursday's drubbings. It's hardly turned into a new uptrend just yet.
We'll look at what the beginning of a new uptrend will look like below. Firs though, let's recap last week's biggest economic announcements, and preview what's in the cards for this week.
Spoiler alert: Inflation hasn't been curbed yet.
Economic Data Analysis
There was really only one data set from last week we're interested in exploring…. Inflation, for consumers as well as companies. Forecasters were expecting to see a bit of easing from March's still-brisk price increases. But, they didn't really get it. The overall consumer inflation rate now stands at 8.3%, but even removing the volatile costs of food and energy prices are still 6.2% above where they were a year ago. As for producers, their costs are up 11.0% from year-ago levels as a whole, and higher by 6.0% when not considering commodity costs. That's stifling.
Consumer, Producer Inflation Charts
 [1]
[1]
Source: Bureau of Labor Statistics, TradeStation
Everything else is on the grid.
Economic Calendar
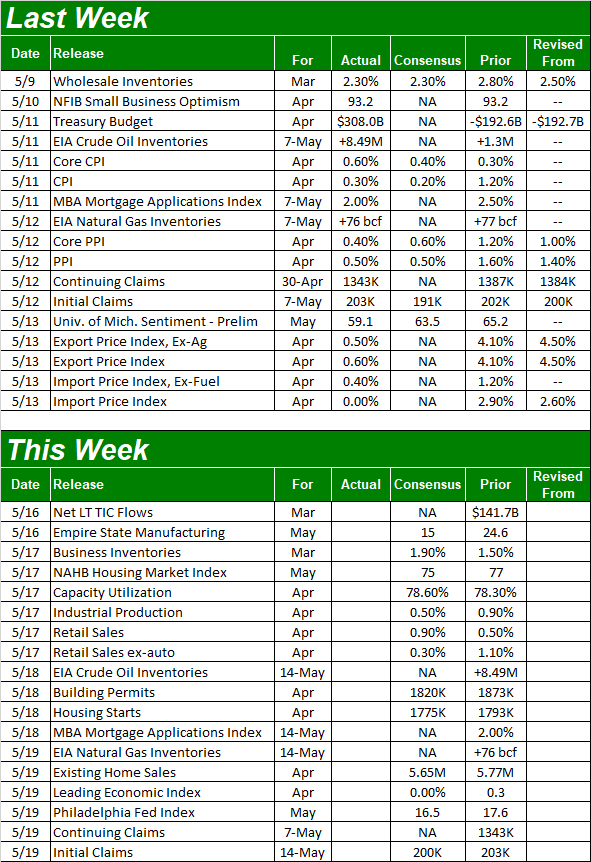 [2]
[2]
Source: Briefing.com
This week won't be too terribly busy, but we are getting a handful of reports with the potential to move the market.
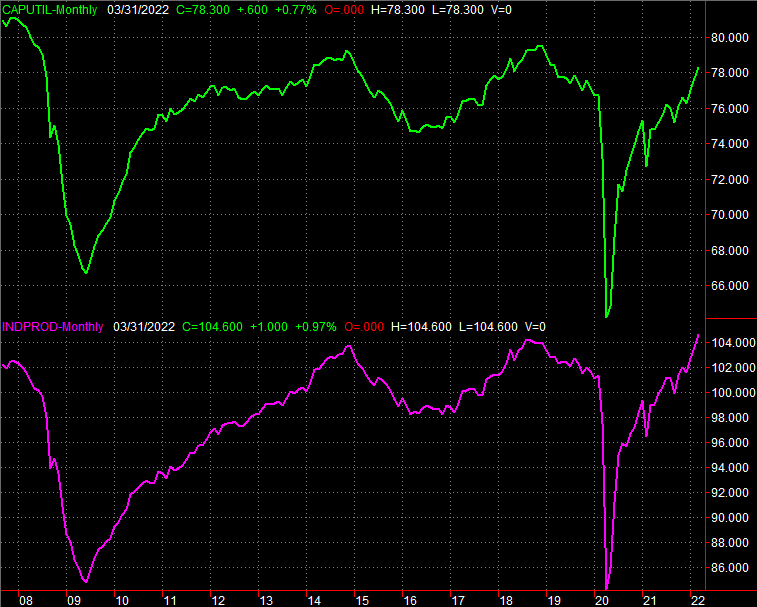
The party starts on Tuesday with the Federal Reserve's look at April's usage of the country's factory production capacity, and our factories' actual productivity. Economists are calling for slight improvements on March's levels for both, although given how the first estimate of the U.S. GDP fell — and by more than expected — for the first quarter, those may be overly optimistic outlooks. Besides, both numbers are at seemingly unsustainable levels.
Capacity Utilization, Industrial Productivity Charts
 [3]
[3]
Source: Federal Reserve, TradeStation
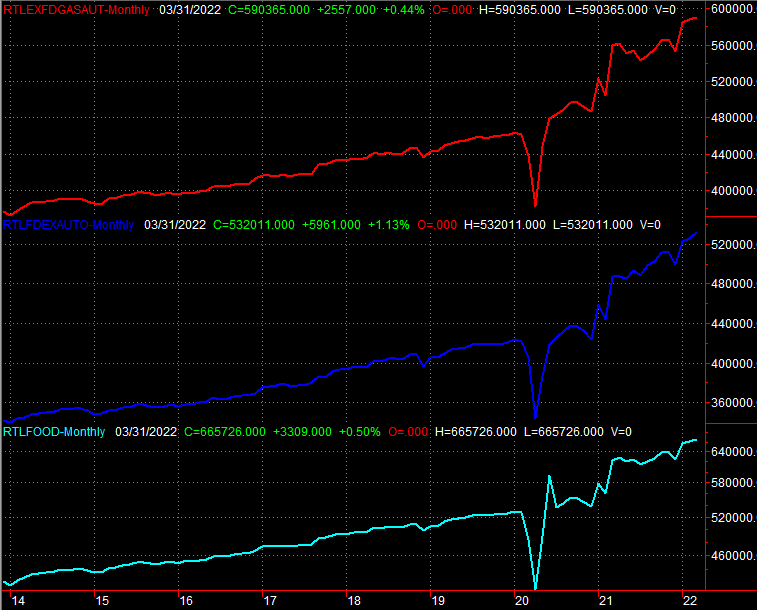
Also on Tuesday look for last month's retail sales. They should have grown again, with or without automobiles in the mix. But, that growth remains inconsistent thanks to inflation pushing and pulling prices across the board.
Retail Sales Charts
 [4]
[4]
Source: Federal Reserve, TradeStation
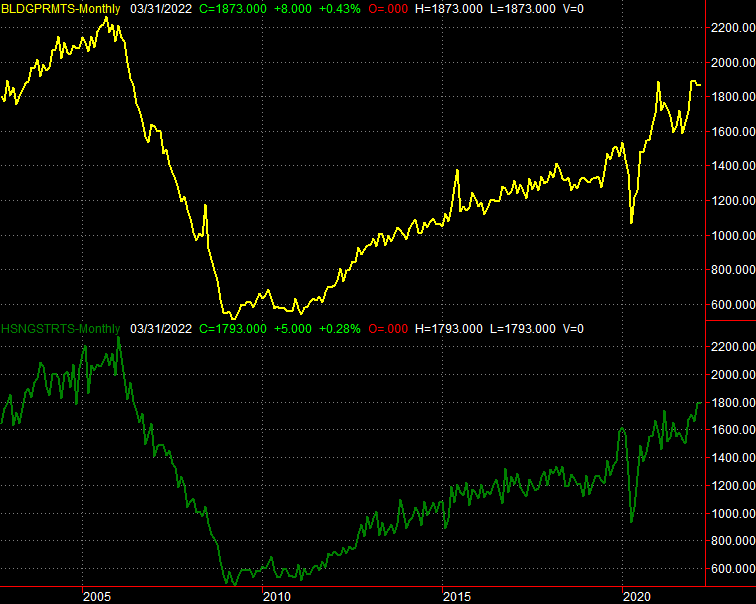
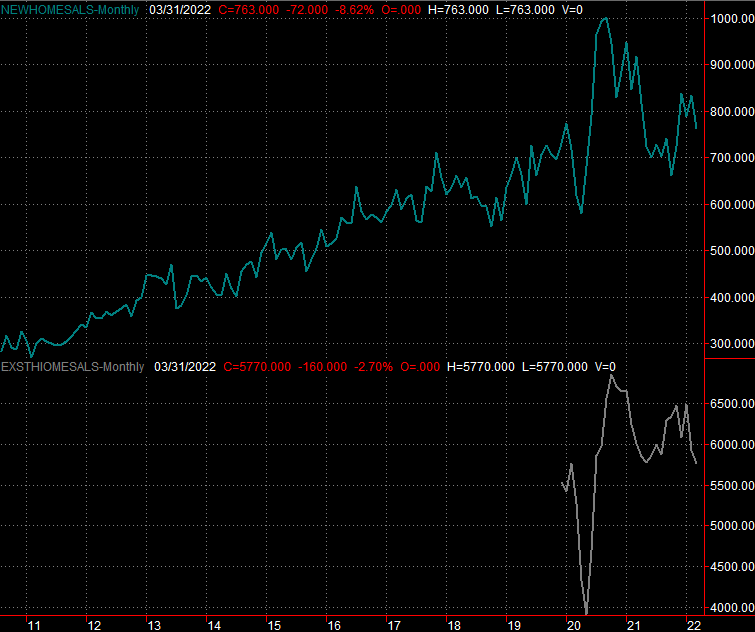
Finally, this week kicks off a three-week streak of real estate data, beginning with housing starts and building permits figures for April on Wednesday, and existing home sales numbers for April coming on Thursday. Starts and permits are expected to look more or less like March's numbers, as are sales of existing homes. Do note, however, that March's sales are less than thrilling. Higher interest rates may already be taking a toll on the market, even if starts and permits don't show it yet.
Housing Starts, Building Permits Charts
 [5]
[5]
Source: Census Bureau, TradeStation
Home Sales Charts
 [6]
[6]
Source: National Association of Realtors, TradeStation
Stock Market Index Analysis
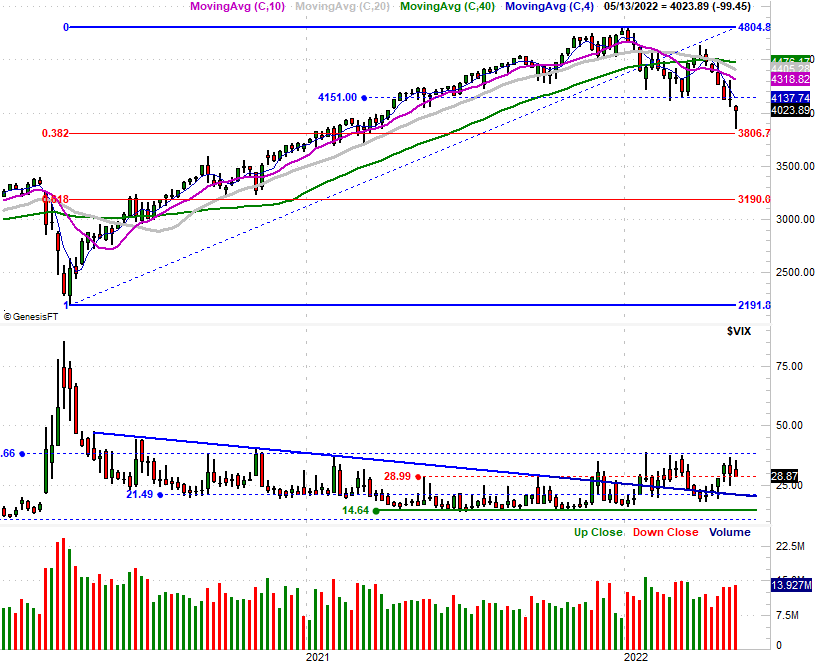
Last week could be the reversal the bulls have been waiting for. After a 16.8% slide from March's peak to last week's trough, the stage is certainly set for such a move. And, the shape of last week's weekly bar suggests a bottom has been made. Take a look. It's in the shape of a hammer, where the open and close are both near the top of a tall range. This hints that the market may have transitioned from a net-selling to a net-buying environment, washing out the last of the would-be sellers in the middle of the week, who ceded control to the buyers in the latte half of the week.
S&P 500 Weekly Chart, with VIX and Volume
 [7]
[7]
Source: TradeNavigator
As for as bottoms go though – true capitulations – last week is less than ideal. Namely, we didn't get the true "blowout" feeling that was accompanied by a surge in fear. We also didn't see a surge of selling volume that would indicate one final flushout of anyone that hadn't sold yet.
Take another look at the weekly chart of the S&P 500 above. Actually, take a look at the volatility index (or VIX) in the middle of the chart. While its relatively high compared to its recent values, major market bottoms tend to coincide with sharp, pointed "spikes" from the VIX… like we saw in March of 2020.
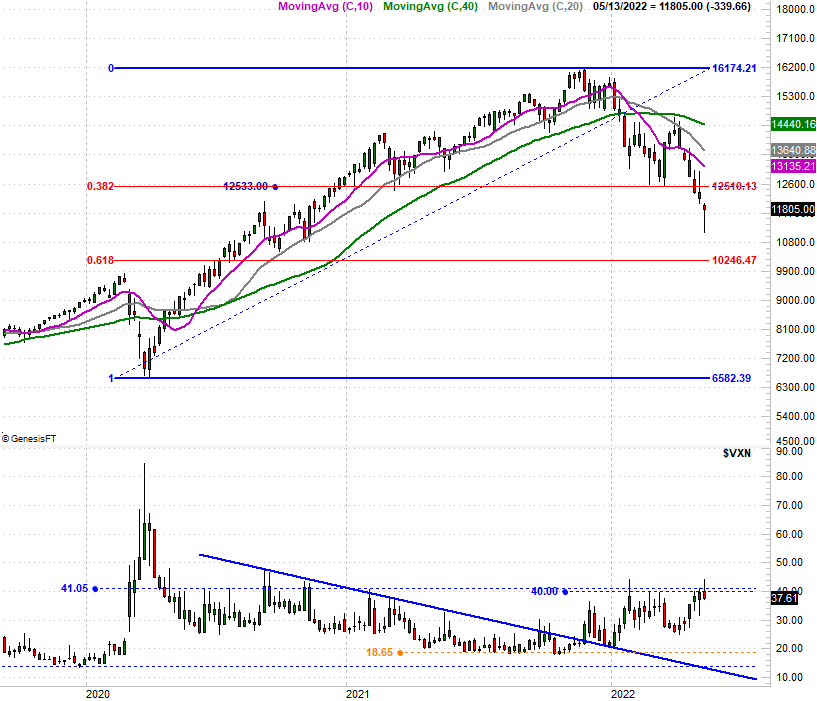
The weekly chart of the NASDAQ Composite looks similar, although not identical. We see the same hammer-shaped bar here, suggesting a transition from a selling to a buying environment. But, again, the NASDAQ's volatility index (VXN) didn't give us a good solid, well-defined, pointed spike.
NASDAQ Composite Weekly Chart, with VXN
 [8]
[8]
Source: TradeNavigator
You probably noticed something else on both weekly charts above… the horizontal lines. These are Fibonacci retracement lines. In this case, the retracement in question is a retracement of the span covered between the March-2020 low and the highs hit near the end of last year. These are the market's natural (psychological) floor and ceilings. In fact, you can see the NASDAQ briefly paused at its 38.2% Fibonacci retracement level of 12,533 back in March. It took a second try this month to break under that support. Once that floor cracked though, the sellers started gunning for the next one to test as support.
This matters… potentially. Last week's low didn't touch or test any Fibonacci retracement lines. Not that the indices have to do so to start a reversal, but it's a better argument for a reversal when it happens. Indeed, without a spike from the volatility indices and without a volume surge either, the argument for continued bullishness from here isn't very good at all, despite the strong ending to the week.
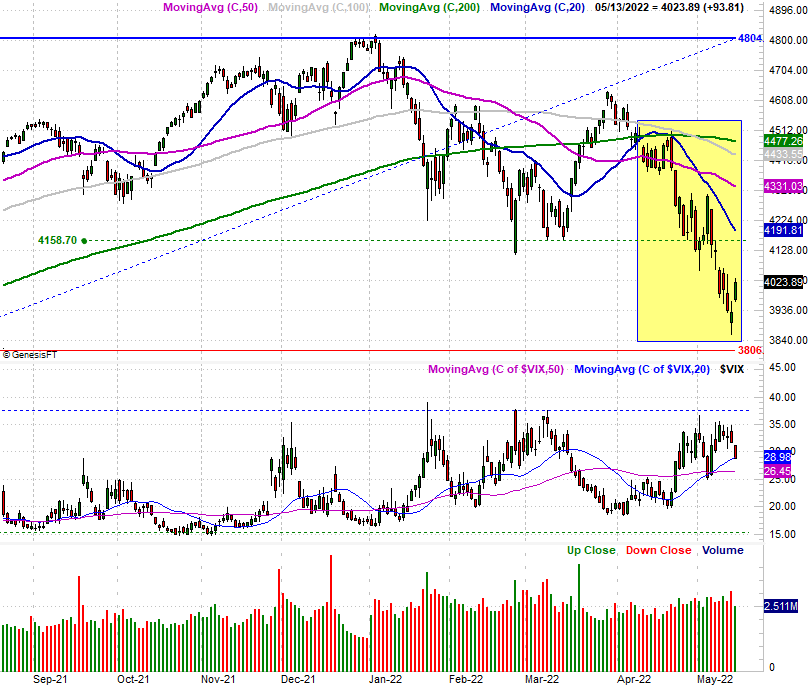
In any case, here's a look at the daily chart of the S&P 500, which will give you a little more detail about last week's plunge and bounce. The VIX's lack of a spike is even clearer here, but you'll also see that even though stocks were raging higher on Friday, Friday was the lowest-volume day of the week.
S&P 500 Daily Chart, with VIX and Volume
 [9]
[9]
Source: TradeNavigator
For now, be content to stay on the sidelines and let the market figure out what it's really going to do next. Odds are good we'll start this week on the same bullish foot we ended last week on. Just don't be too impressed if that happens. There's some room to rally before hurdling any major technical resistance levels.
In the meantime, be sure to put all the Fibonacci retracement levels on your radar.