
That's the second weekly loss in a row, and once again, it wasn't a small one. All told, the S&P 500 fell 2.1% in last week's shortened action, and now stands more than 5% below highs hit just three weeks ago.
The momentum is clearly a problem for the broad market (though not a problem for traders with bearish positions). But, it's not even the market's chief problem right now. More problematic than that is the shape and location of last week's daily bars, and where the index ended up closing.
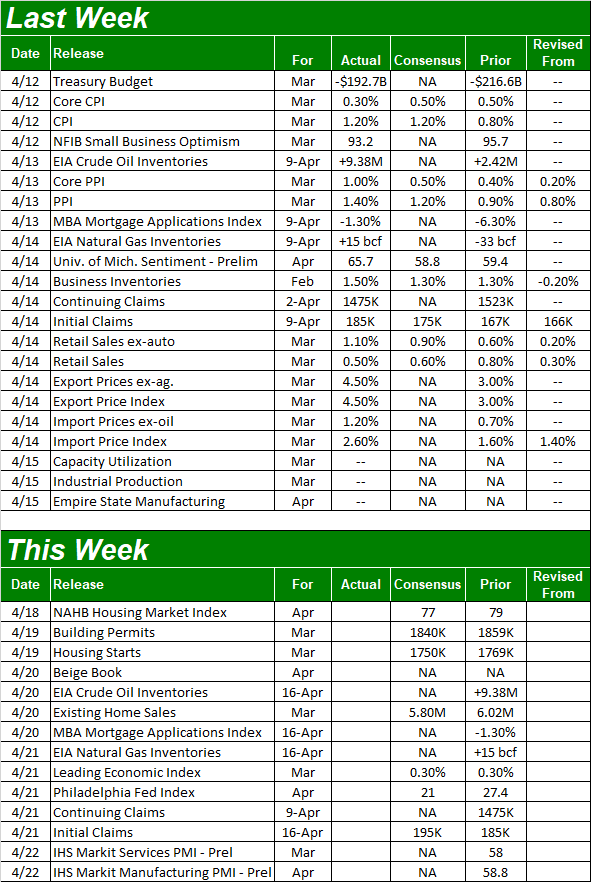
We'll look at that bigger problem in a moment. First though, let's run through last week's biggest economic announcements and preview what's in the lineup for this week. Spoiler alert: It's a huge week for real estate numbers, fleshing out just how much damage rising interest rates are already doing.
Economic Data Analysis
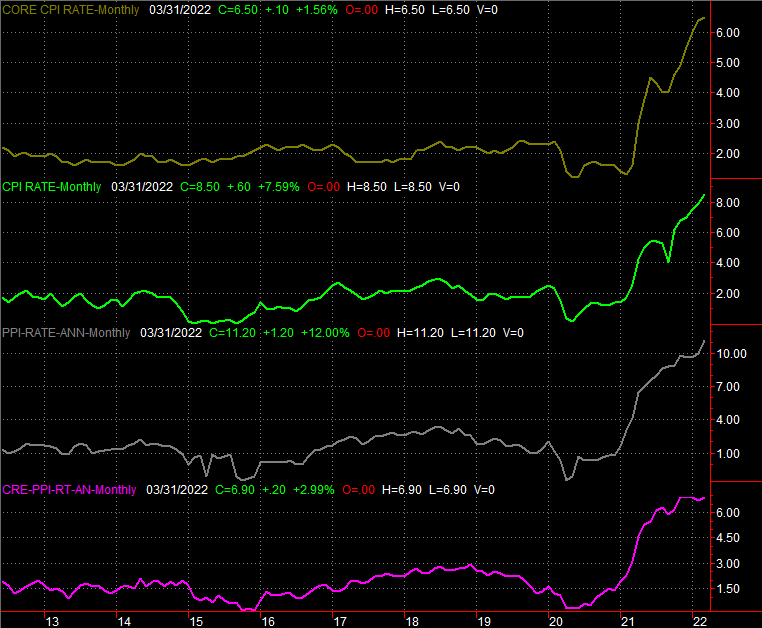
While this week's going to be a bigger for real estate, last week's heaviest-hitting data was all about inflation. There's plenty of it. Overall, consumers are paying 8.5% more for goods and services than they were a year ago. Not counting food or gas, prices are still 6.9% higher. For producers (factories, assembly plants, etc.), overall costs are up by a record-breaking 11.2% for the month of March, and higher by 6.9% on a core basis.
Consumer and Producer Inflation Rate Charts
 [1]
[1]
Source: Bureau of Labor Statistics TradeStation
No matter how you slice it, the Fed has to follow through on its plan to de-stimulate the economy, unwinding much of what it did to keep the economy afloat during the pandemic. Even then though, that may not be enough soon enough.
Despite sharply rising prices, retail consumption remains brisk. Granted, much of March's uptick in retail spending can be attributed to higher prices. Even so, people aren't balking at their higher costs… at least not yet. Overall retail spending not counting automobile sales was 1.1% higher in March (annualized) than it was in February.
Retail Sales Charts
 [2]
[2]
Source: Standard & Poor's, Case-Shiller, FHFA, TradeStation
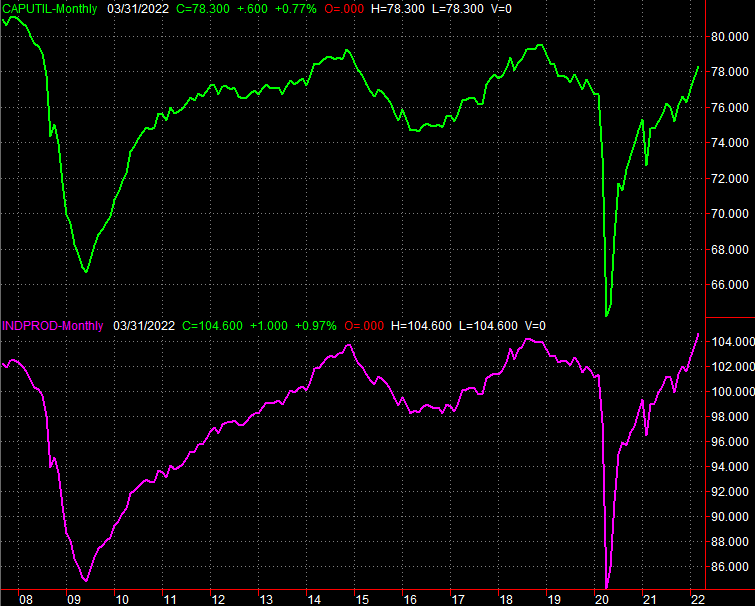
Finally, though the market was closed on Friday, the Federal Reserve still published last month's capacity utilization and industrial productivity data for March on that day. It was good. In fact, it was great, providing a much needed spark of hope. The industrial productivity index reached a record high of 104.6, while the nation's usage of its production capacity has moved well above pre-pandemic levels. It's a sign that no matter how people feel or what the headlines suggest, plenty of goods are being made and bought.
Capacity Utilization and Industrial Productivity Charts
 [3]
[3]
Source: Federal Reserve, TradeStation
Everything else is on the grid.
Economic Calendar
 [4]
[4]
Source: Briefing.com
This week isn't a terribly big one, which will allow investors to focus in the beginning of earnings season. There are a couple of items to keep an eye out for though.
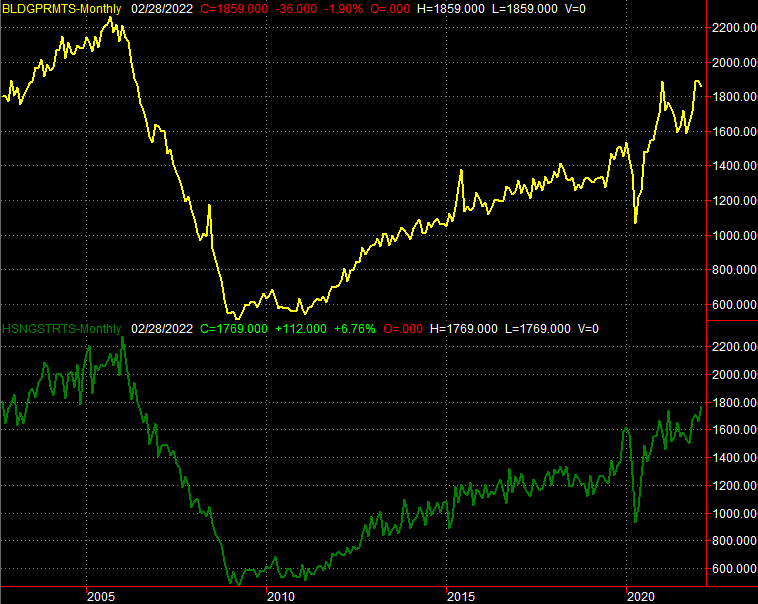
The first of these will be Tuesday's housing starts and building permits. Despite waning demand for homes and mortgage loans, builders are still mostly forging ahead. March's permits and starts should only be slightly lower than February's pace, but February's numbers were actually pretty healthy.
Housing Starts and Building Permits Charts
 [5]
[5]
Source: Census Bureau, TradeStation
It's a surprising expectation, all things considered. But, perhaps it's a little too soon to expect building activity to slow down… if it's going to slow at all.
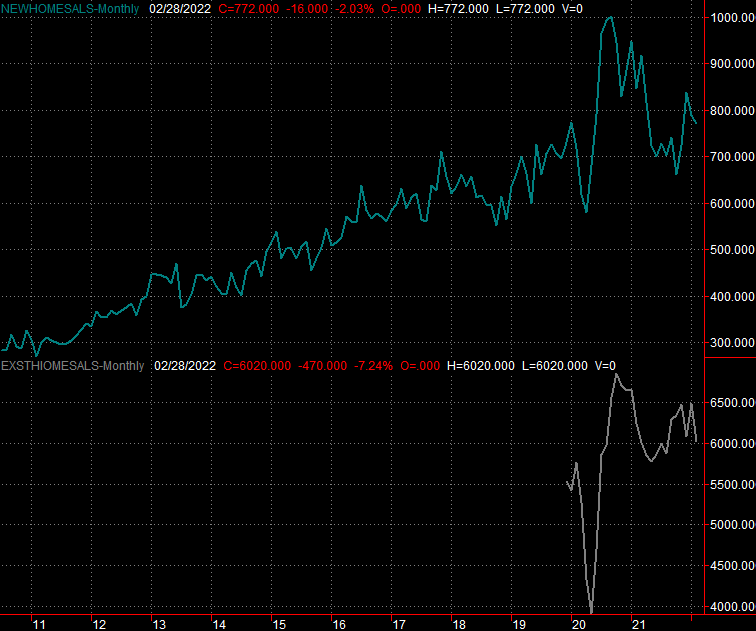
To this end, March's sales of existing homes will be posted on Wednesday. Forecasters are calling for a cooling, from February's 6.02 million to a pace of 5.8 million for last month. That's going to be the worst month since May of last year, and near the worst month since early 2020 when the pandemic's arrival in the United States brought sales to a screeching halt.
New, Existing Home Sales Charts
 [6]
[6]
Source: Census Bureau, National Association of Realtors, TradeStation
It's not something we normally look at, but it might be worth keeping your eyes and ears open for Wednesday's crude oil inventories figure as well as Monday's NAHB Housing Market Index. Both sets of numbers have bigger implications now than they normally might.
Stock Market Index Analysis
With nothing more than a passing glance at the charts it would be easy to dismiss last week's weakness as just a little bad luck. Sometimes the market moves higher. Sometimes it moves lower. Last week it moved lower. It doesn't necessarily have to mean the market's destined to continue inching lower.
Except, there's more bad news packed into last week's charts than it may seen with just a quick look. A longer review reveals some mostly-ignored red flags.
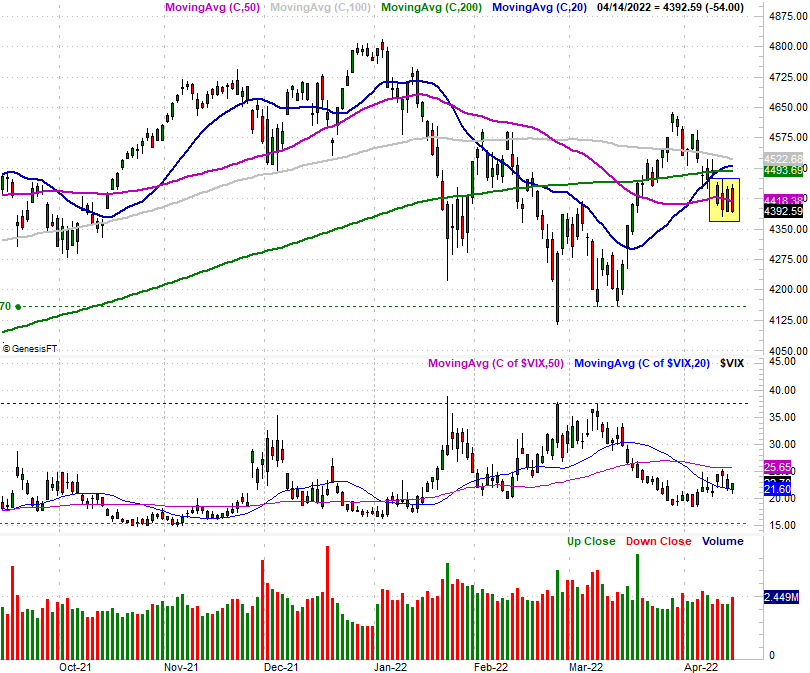
For the S&P 500, one of those red flags is the fact that it closed under its 50-day moving average line (purple) last week after dancing all around it for the entire week. It's now under all of its key moving averages, in fact.
S&P 500 Daily Chart, with VIX and Volume
 [7]
[7]
Source: TradeNavigator
That's not the only remarkable thing to note of last week though. It's not THE most remarkable detail about last week either. Far more noteworthy is last week's high and low, and how the index remained tightly range-bound between 4390 and 4460 the whole week, but used almost all of that range each trading day. Also notice that it was largely reversing its previous day's move most of the time.
It's a sign of above-average indecision… an idea underscored by the fact that the S&P 500's Volatility Index, or VIX didn't give us much net movement either.
This "cluster" of range-bound daily bars, however, is still a red flag in and of itself. By virtue of doing nothing on a net basis, traders have spring-loaded a pent-up move that is apt to unload in a hurry once triggered. Given the bearish end to the week, the more likely move is a downward pointing one.
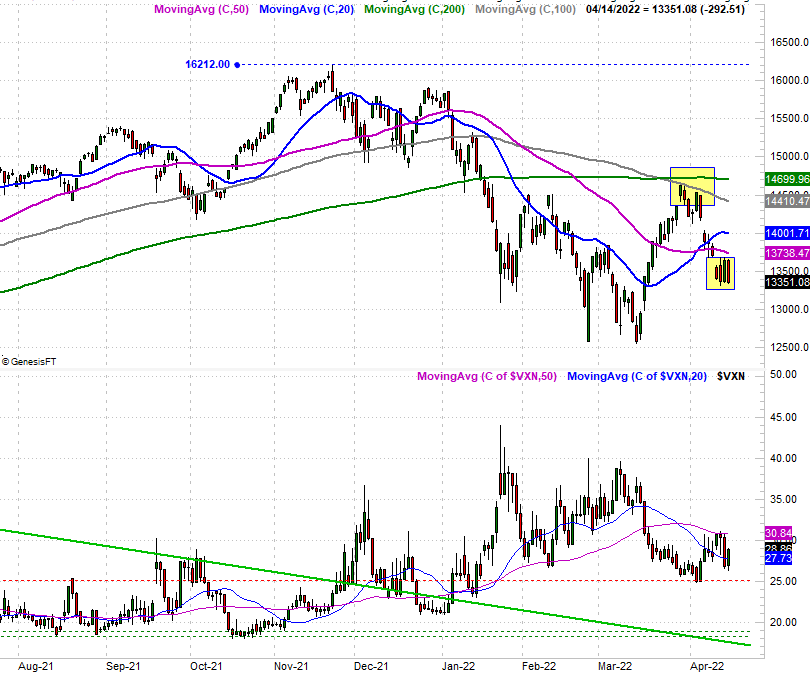
Note how the daily chart of the NASDAQ Composite formed the same narrow-range-bound cluster of intraday action, also ending the shortened trading week on a bearish foot.
NASDAQ Composite Daily Chart, with VXN
 [8]
[8]
Source: TradeNavigator
Here's the weekly chart of the S&P 500 for a little added perspective. From this viewpoint we can see how well the downtrend that started in January is starting to restart… again.
S&P 500 Weekly Chart, with VIX and Volume
 [9]
[9]
Source: TradeNavigator
Still, there's a major technical support level still hovering at 4151, where the index ultimately found a floor in February and March.
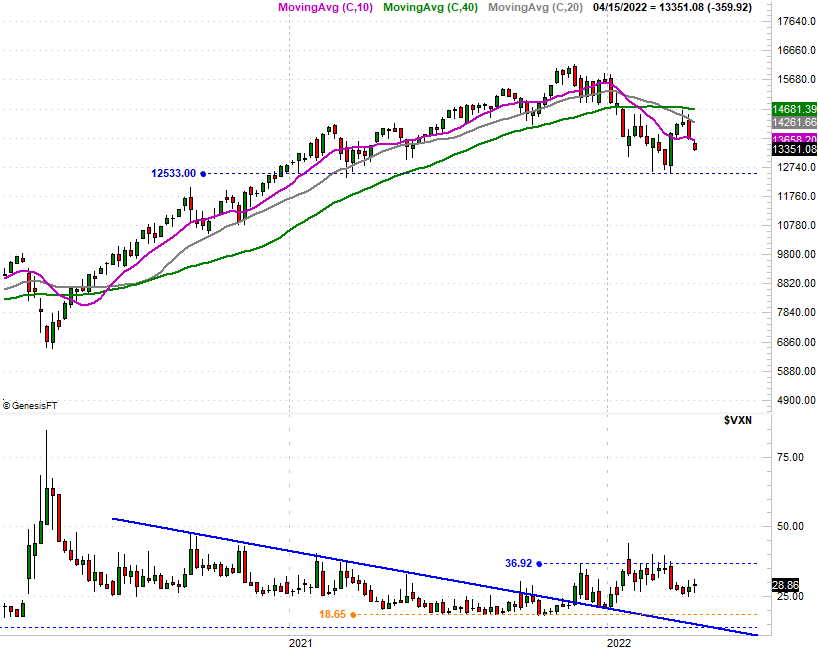
The NASDAQ Composite has a similar floor at 12,533, though the composite is technically in worse shape. As we noted last week, all four of the NASDAQ's key moving average lines are now sloped in a downward direction. It's a hint that the undertow is indeed bearish.
NASDAQ Composite Weekly Chart, with VXN
 [10]
[10]
Source: TradeNavigator
All the same, assume nothing here. Headlines are pushing and pulling the market around here, and traders are struggling to get — and keep — a handle on anything. That's why the market was so back and forth last week, making little net progress from Monday's close. The close below all of the key moving averages, however, means the market is starting earnings season on the defensive this week.