
There wasn’t much “umph” behind last week’s bullish effort. But, there didn’t need to be. The bulls only needed to demonstrate a little bit of follow-though on the previous week’s turnaround, which it did. This is a pace at which the market can keep climbing despite the lethargy we usually see around this time of year.
And yet, there’s good reason to remain prepared for the worst even as we hope for the best. The volume behind last week’s advance was very, very thin, and there’s some pretty serious technical resistance for both of the key indexes we watch immediately above current levels. The bulls may hit a well yet.
We’ll take a detailed look at those resistance levels in a moment. Let’s first run through last week’s more important economic news and preview what’s in the lineup for this week.
Economic Data Analysis
Not a lot of important news from last week, but the important stuff we got was really, really important. And not necessarily bullish.
Take last month’s economic barometers from the Institute of Supply Management as an example. The ISM Manufacturing Index fell a bit further below the pivotal 50 mark, while the ISM Services Index took a surprise tumble under the 50 level, falling to 49.9 rather than rising from 51.6 to 52.2 in May. It’s impossible to deny that both data sets are now in clear downtrends, which of course bodes poorly for the overall economy.
ISM Services, Manufacturing Charts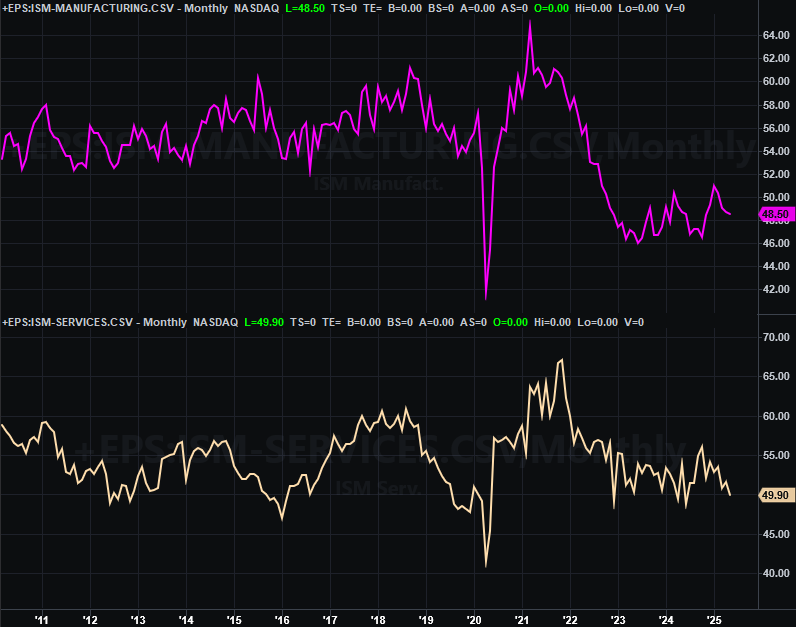
Source: Institute of Supply Management, TradeStation
The only other truly noteworthy numbers posted last week is Friday’s jobs report, also for May. Although payroll growth fell from April’s downward-adjusted pace of 147,000, the 139,000 new jobs reported was close to the prior month’s count, and higher than the expected 125,000. Perhaps more important, that was enough payroll growth to leave the unemployment rate at a reasonably healthy 4.2%.
Unemployment Rate, Payroll Growth Charts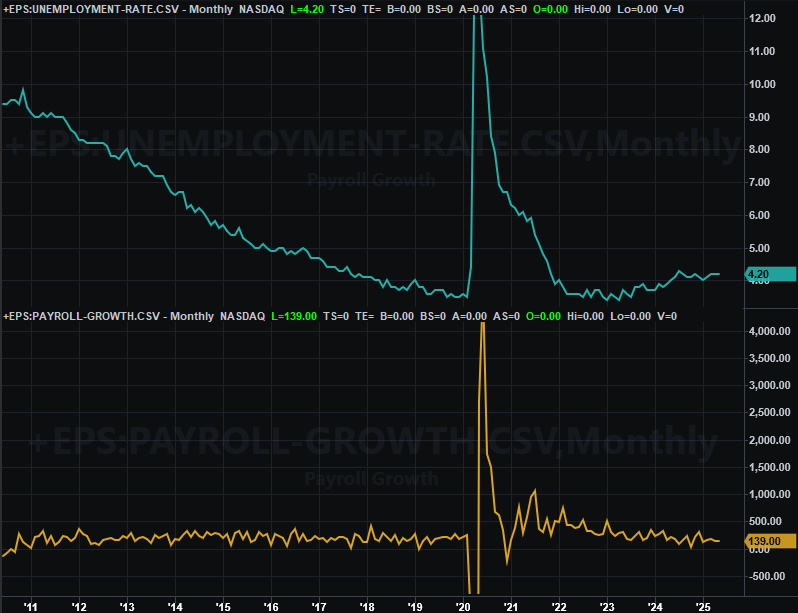
Source: Bureau of Labor Statistics, TradeStation
You have heard that the JOLTS (Job Openings/Labor Turnover Survey) indicated a swell of new openings in April, hinting at economic growth. Just don’t read too much into that take. We’re seeing a trend of posted available jobs that rarely lead to an actual hiring. Meanwhile, ADP’s employment growth figure fell from April’s 60,000 to 37,000 last month rather than rising to the projected 110,000 jobs. The labor market’s report card is still mostly up in the air.
Everything else is on the grid.
Economic Data Report Calendar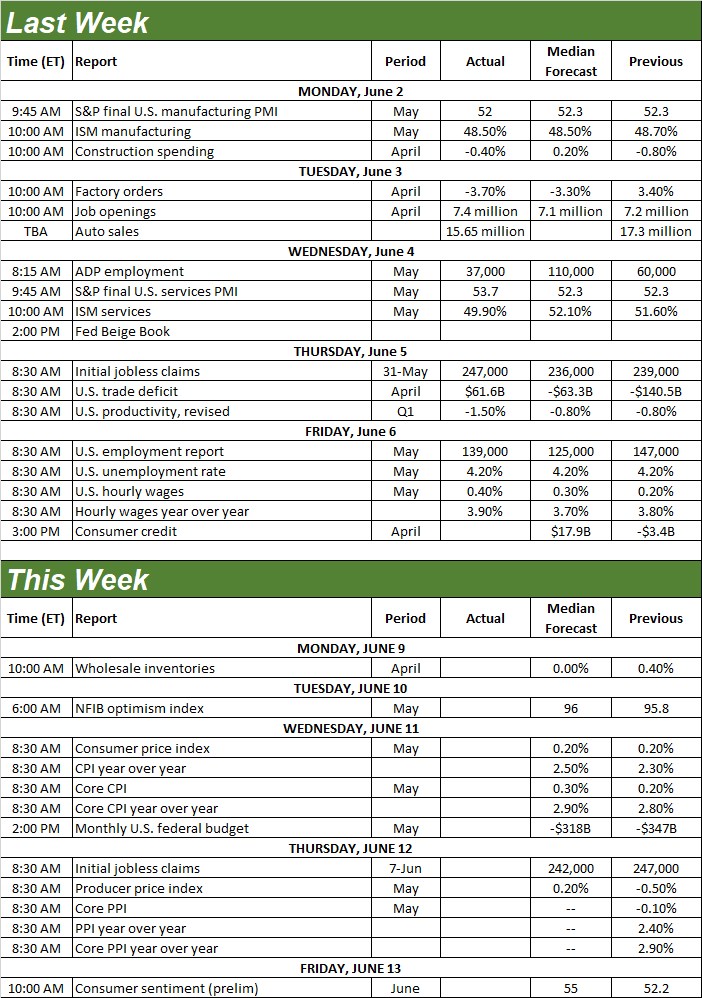
Source: Briefing.com, TradeStation
This week’s pretty light, but once again, the little bit of important stuff we’re getting is very, very important. On Wednesday look for last month’s consumer inflation report, followed by producer inflation figures on Thursday. Consumer inflation has been cooling since 2022. Producer inflation finally followed suit beginning early this year. Economists now think things are going to start leveling at these current (and palatable) levels.
Consumer, Producer Inflation Rate Charts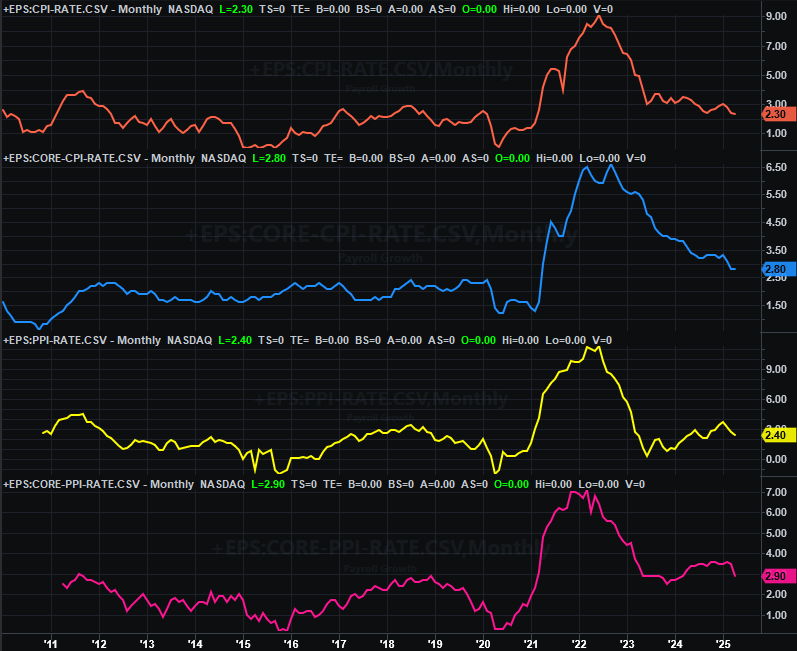
Source: Bureau of Labor Statistics, TradeStation
This isn’t the only data the Federal Reserve considers when making interest rate decisions, by the way. It’s not even the primary data it considers. That honor belongs to personal income and consumer spending.
Nevertheless, to the extent this coming week’s report does matter, there’s room for the FOMC to cut rates sooner than later. The market’s still betting it won’t happen until September though.
Stock Market Index Analysis
Building on the previous week’s slight recovery effort, stocks made forward progress again last week. All told, the S&P 500 advanced 1.5% last week, barely making a new multiweek high in the process.
Still, progress is progress. The fact that the index put some more distance between itself and all of its key moving average line (which recently made bullish crossovers… as circled on the daily chart below). The path of least resistance is higher.
S&P 500 Daily Chart, with VIX and Volume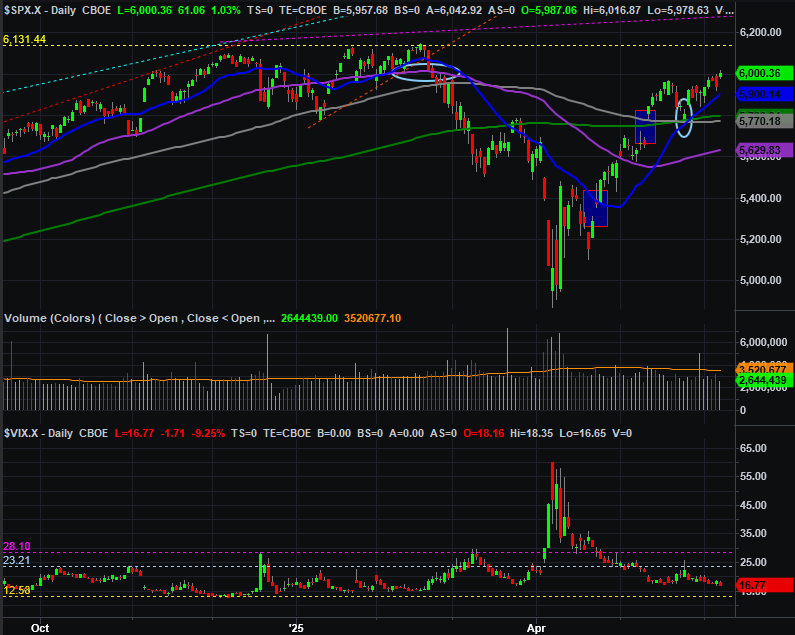
Source: TradeNavigator
There are modest concerns, however. One of them is the fact that there was only light volume behind the move, just as there’s been modest volume the whole way up from April’s bounceback from the steep marketwide selloff. Ideally, you’d see at least average — and growing — volume behind a rally that’s built to last.
It’s certainly possible the lack of volume could simply reflect the usual disinterest in trading that we often see this time of year. That’s what the middle portion of the chart below (comparing the S&P 500’s recent daily action to the NYSE’s “up” volume and “down” volume trends say anyway. While up volume is waning, down volume is as well. Nevertheless, you need volume to keep moves going.
S&P 500 vs. % Above/Below 200-Day Moving Average and NYSE Up/Down Volume 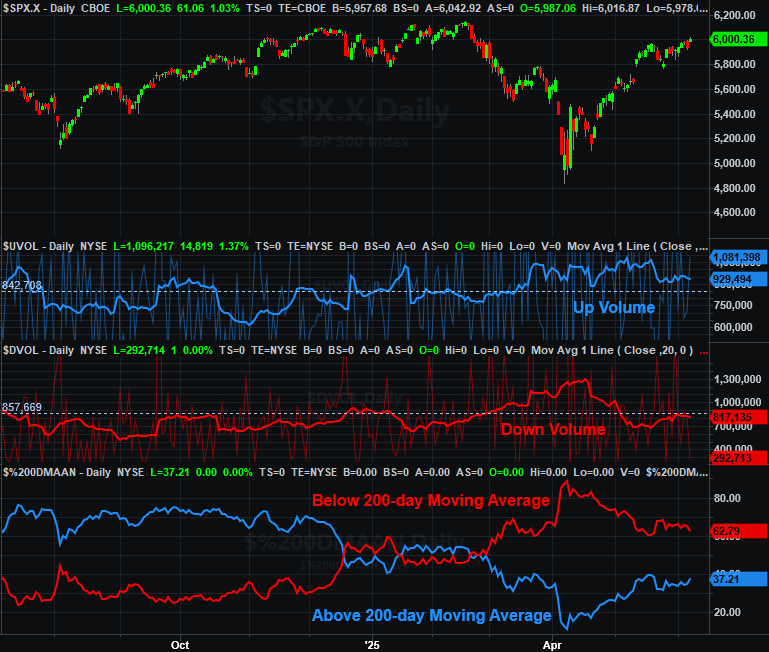
Source: TradeNavigator
On the bottom portion of the chart above there’s another hint that this current bullish effort isn’t exactly well-supported. Although the S&P 500 is currently above its pivotal 200-day moving average line (green) at 5,796, most of the stocks in the S&P 500 aren’t. Only 37.2% of the index’s constituents are above that mark, once again calling into question just how much gas is in the current rally’s tank.
Perhaps the bigger concern at this time, however, is what lies just a little farther out. That’s a technical ceiling around 6,131, where the S&P 500 peaked in February. In a similar vein, the S&P 500’s Volatility Index (VIX) at the bottom of the chart is about to drift into something of an absolute technical floor around 12.6. While simply touching this support doesn’t have to mean the market rolls over, it’s certainly more difficult for stocks to continue making gains when the VIX is this low.
And it’s no coincidence that the S&P 500 is approaching its big technical ceiling right around the same time the VIX is nearing a floor.
Here’s the daily chart of the NASDAQ Composite, which looks about the same, with the same analytical response. That is, the VXN is nearing a major support level while the Composite itself is approaching an important technical ceiling. And like the S&P 500, there’s a distinct lack of volume — even waning volume — with the current advance.
NASDAQ Composite Daily Chart, with VXN and Volume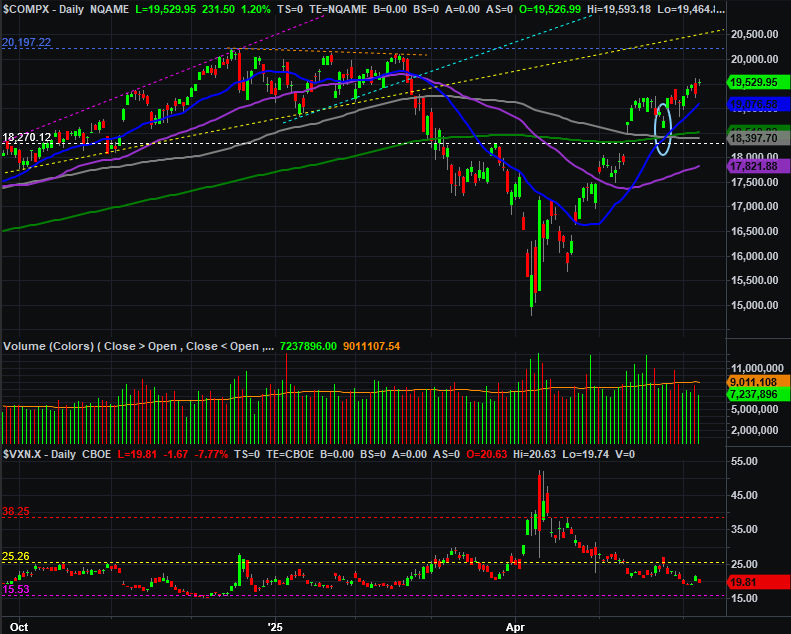
Source: TradeNavigator
We have to side with the direction of the market’s current momentum. So, yes, we’re bullish here. This is a wobbly (at best) bullish effort though that’s about to be tested in a pretty big way. This certainly isn’t a time to be blindly plowing into a bunch of new long trades.