
Yes, the market finally snapped its four-week losing streak. It’s too soon to celebrate just yet though. As we warned last week, stocks had fallen so far so fast that we could have counted on at least a mild bullish pushback. That’s what we got, but just barely. It certainly wasn’t a strong or convincing enough effort to jolt the market back into a robust bull market. We could still easily slip back into more selling. In fact, we’d argue that might be the best thing in the long run, forcing a capitulation that clears the bullish decks for the long haul even if it hurts a bit in the short run.
We’ll discuss the idea in some detail in a moment. First, let’s look at last week’s top economic news and preview what’s coming this week. And just to whet your appetite, there’s more encouraging news than not.
Economic Data Analysis
Last week’s big news was of course Wednesday’s decision regarding interest rates. But, it was also the least meaningful and least interesting. As expected, the Federal Reserve left the Fed Funds Rate alone, but the FOMC is still leaving the door open to a couple of rate cuts later this year.
And honestly, that’s probably for the best. Although the economy is doing well, it’s not doing exceedingly well. It’s doing just good enough to where the Fed doesn’t feel compelled to tinker. Take retail spending as an example. While consumer spending did bounce back a little from January’s surprise lull, it didn’t bounce back nearly as much as expected.
Retail Sales Charts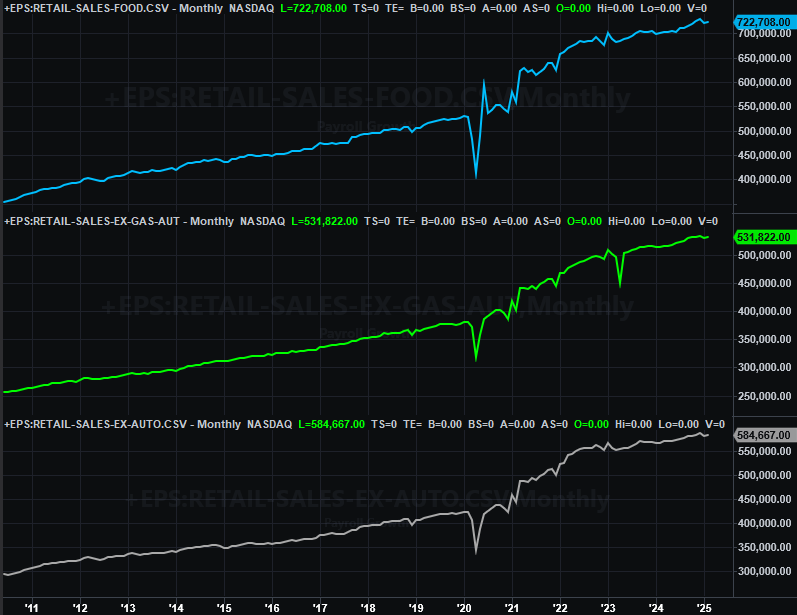
Source: Census Bureau, TradeStation
There are some signs of economic recovery though, even if it’s not convincingly coming in the form of retail spending. Although building permits in February were in-line with January’s levels, actual housing starts rolled in much better than January’s pace of 1.35 million and much better than the expected annualized print of 1.38 million.
Housing Starts, Building Permits Charts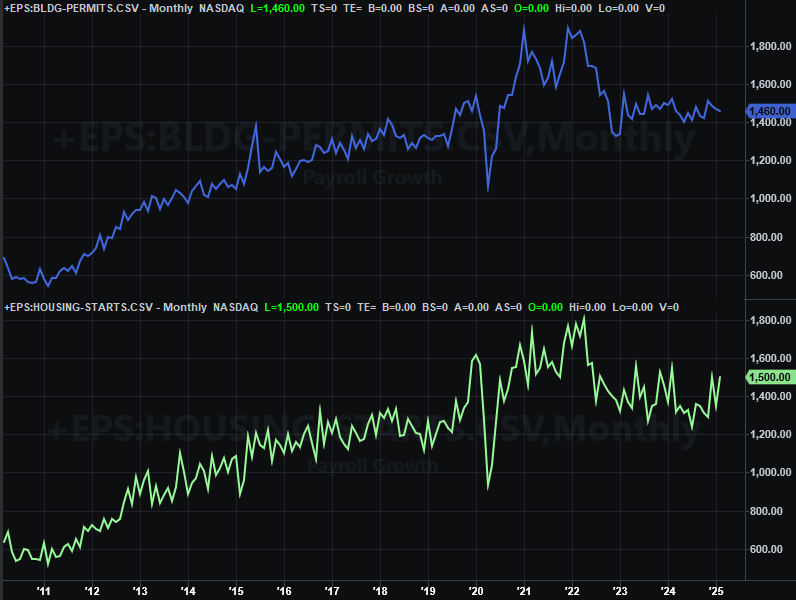
Source: Census Bureau, TradeStation
Obviously permits will need to follow suit eventually. But, this is a start to a housing market rebound. (More on this in a moment.)
Last but not least, underscoring — and arguably improving — last week’s flashes of bullish brilliance is February’s capacity utilization and industrial production figures. They were both up firmly once again, so much so that it’s difficult to suggest the lethargy that was so clear through late last year has been shaken off, with factory activity back in impressive growth mode.
Capacity Utilization, Industrial Production Charts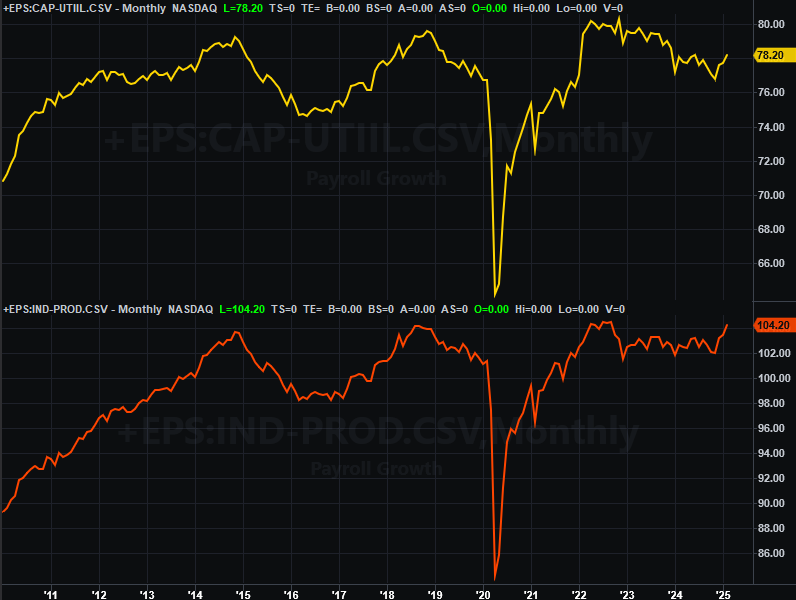
Source: Federal Reserve, TradeStation
This is no small matter either. The correlation between industrial production, capacity utilization, and corporate earnings — and therefore the broad market — is quite strong. This bodes bullishly in the bogger picture, even if it can’t prevent a short-term setback.
Everything else is on the grid.
Economic Data Report Calendar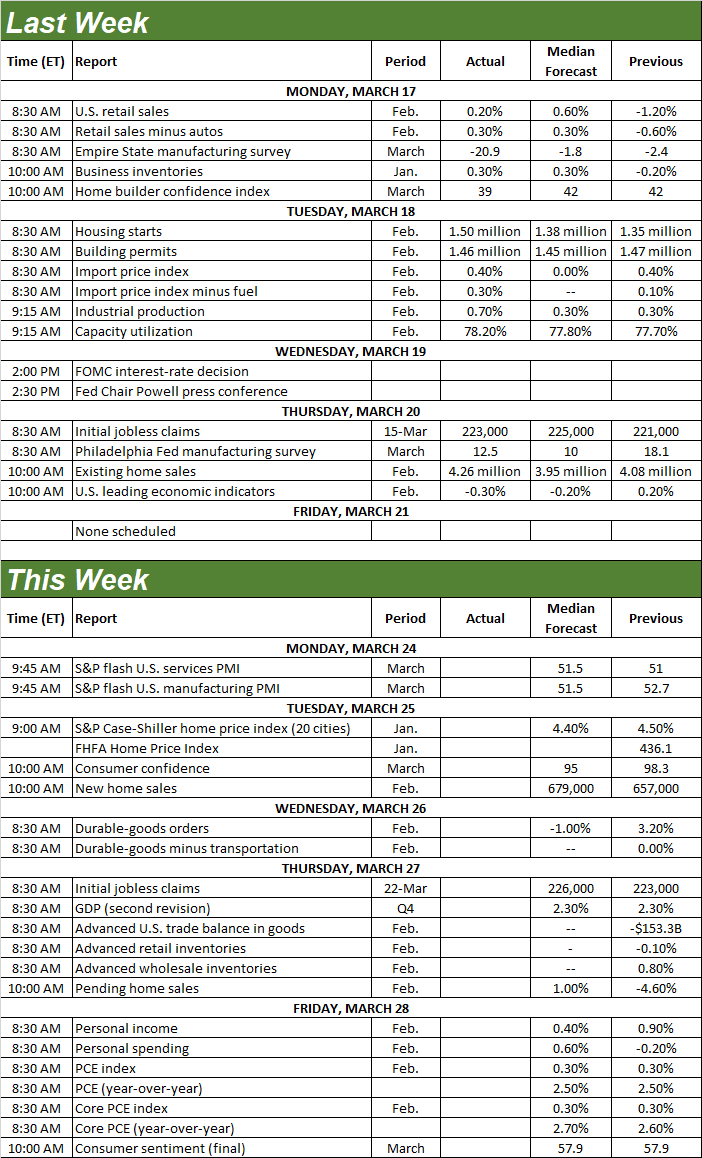
Source: Briefing.com, TradeStation
There was actually one more piece of important real estate news dropped last week. We just held off highlighting because we’ll be hearing its counterpart number this week. That’s home sales. We learned last week that February’s sales of existing homes soared rather than fell, reaching a yearly pace of 4.26 million. That’s still not game-changing, but things are moving in that direction. Let’s see if new-home sales follow suit with Tuesday’s report from the Census Bureau. And remember, starts of new homes jumped last month.
New, Existing Home Sales Charts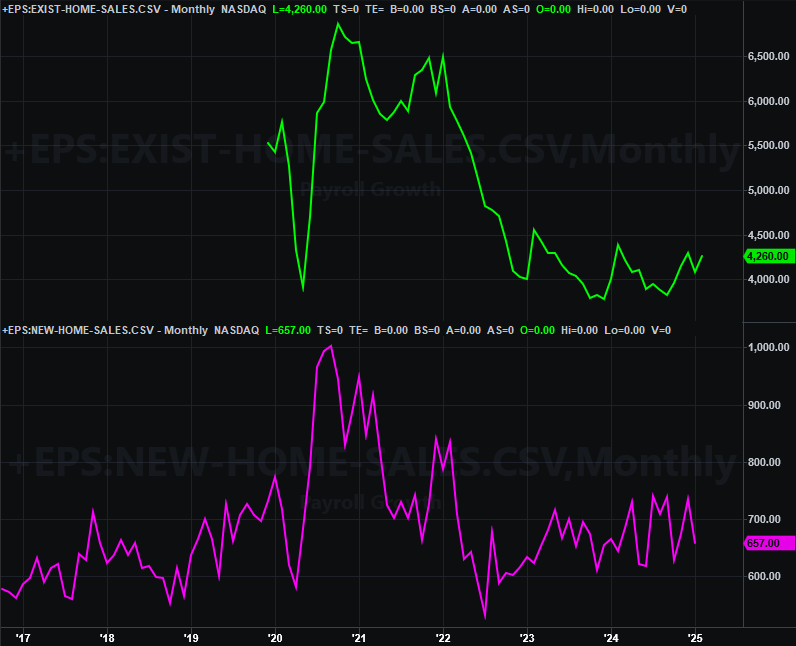
Source: National Assn. of Realtors, Census Bureau, TradeStation
Rounding out this look at the real estate market will by Tuesday’s look at home prices… at least prices of homes that are being sold. Although both the FHFA’s data and the Case-Shiller index are only for January, they should still help give us an idea of what’s really happening here for all facets of the real estate business.
Home Price Charts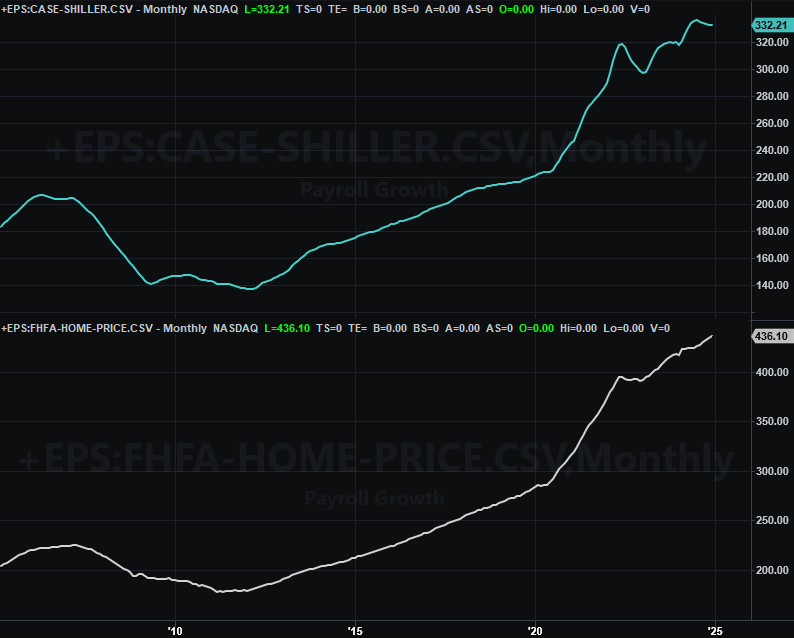
Source: FHFA, Standard & Poor’s, TradeStation
Another biggie in the lineup for this week is a double dose of sentiment. The Conference Board’s consumer confidence number for March is coming Tuesday, while the University of Michigan’s final data for this month is coming Friday. Both are (curiously) expected to sink, perhaps reflective of the market’s extreme weakness earlier in the month.
Consumer Sentiment Charts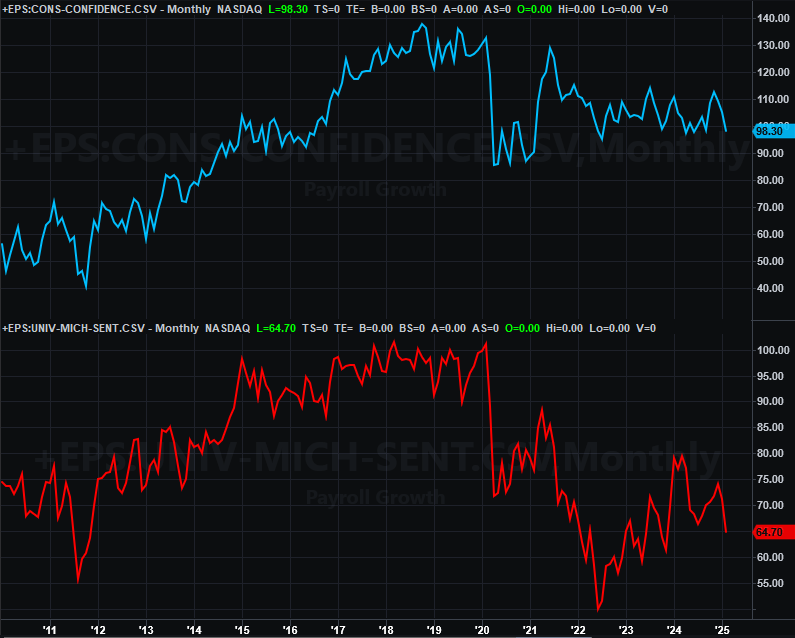
Source: Conference Board, University of Michigan, TradeStation
Also keep your eyes peeled and ears open on Friday for last month’s personal income and spending report. Although we’re not charting it here, this is the data the Federal Reserve considers first and foremost when making decisions about interest rates.
Stock Market Index Analysis
Stocks may have logged a gain last week. The market did so begrudgingly though, acting as if it really didn’t want to. The feeling is that traders know it wasn’t anything more than a dead-cat bounce, and a bounce nobody wants to have actual faith in.
This is readily evident on the daily chart of the S&P 500 below. Take a look. The index followed through on the previous Friday’s strong bounce with a gain on Monday. Stocks never actually made any net bullish progress past that point though. Rather, the S&P 500 established and confirmed a technical ceiling right around 5,700. At the same time, the volatility index’s (VIX) downtrend since later in the week from two weeks ago also appears to be flattening out, suggesting a turnup is brewing. This of course also works against stocks.
S&P 500 Daily Chart, with VIX and Volume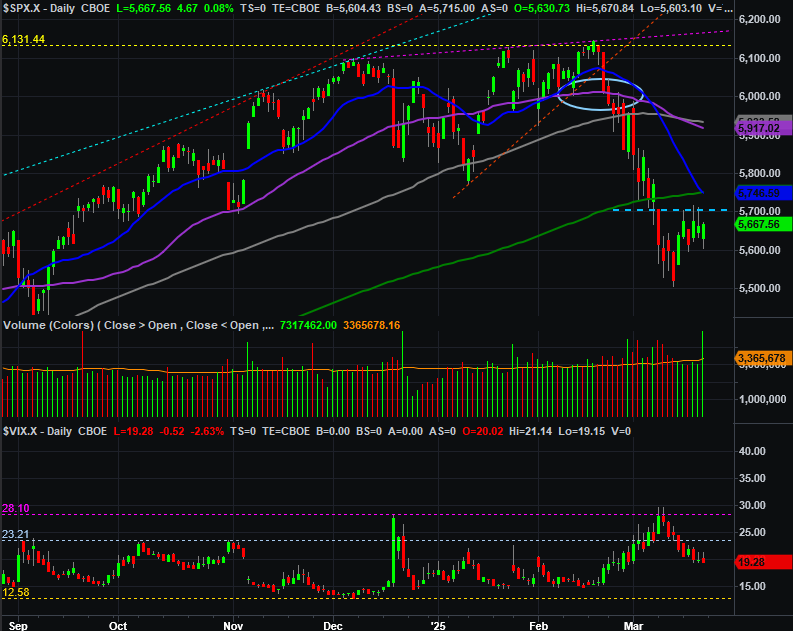
Source: TradeNavigator
And the NASDAQ Composite didn’t fare any better. It managed to log a win for the week as well. But, like the S&P 500, the composite seems to be forming a box, between 17,220 and 17,930. If it doesn’t break out of that range soon, it will only become harder to break out of it later. In the meantime notice that – also like the S&P 500 – several of the NASDAQ’s moving average lines made bearish crossunders last week. That’s also a bearish trigger.
NASDAQ Composite Daily Chart, with VXN and Volume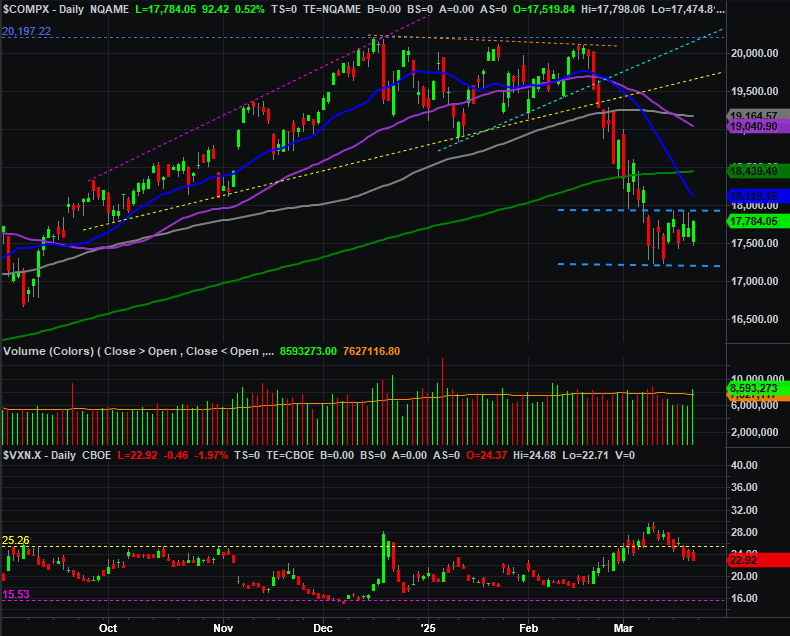
Source: TradeNavigator
The big volume surge on Friday, by the way, actually isn’t all that meaningful. It was expiration day for a whole slew of options, forcing traders into taking action.
Zooming out to a weekly chart of the S&P 500 puts things in more of their proper perspective. The index broke under major technical support near 5,800 a couple weeks back, and even with last week’s slight bounce is still miles away from crawling back above that floor now. The longer it lingers below that mark, the more difficult it will be to crawl back above it. (And yes, the 23.6% Fibonacci retracement line at 5,5187 really did come into play after being brushed two weeks ago. Odds are good it’s still going to play a role in how the index behaves from here, if the bears take over again.)
S&P 500 Weekly Chart, with VIX and MACD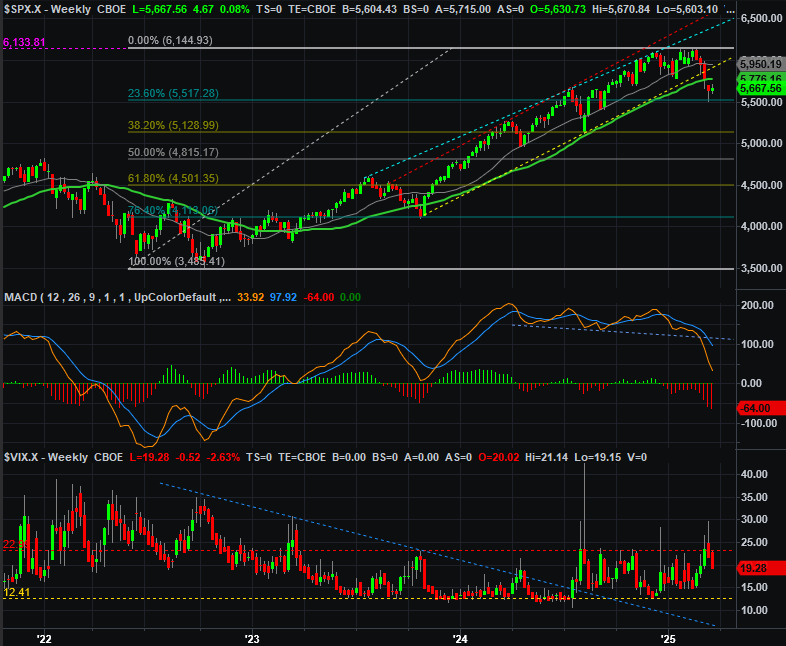
Source: TradeNavigator
So now what? It’s tempting to plow back in anticipation of a sweeping recovery. And, perhaps that’s what we’ll see take shape from here.
There’s something unsatisfying about that possibility though… at least as it stands to veteran traders right now. The fact is, we’ve not suffered a much needed “blowout” capitulation in a long while – the kind that does allow for a renewal of a bull market. Stocks are acting like they innately know that’s what needs to happen now. But, enough bulls are also doing everything they can to prevent it from happening. That’s a face-off you don’t want to participate in, or be on either side of.
The only thing you really want to do from here is watch to see what happens if-and-when the S&P 500 and the NASDAQ Composite test their respective 200-day moving average lines (green). There’s an uncomfortably good chance all it would take is a kiss of those lines to rekindle the selling.
Even if that’s what happens though, it should ultimately set up a compelling buying point — as long as you don’t dive in too early. We’ll be looking to the S&P 500’s other Fibonacci retracement lines to get a feel for where such a bottom is likely to materialize.