 [1]Against the odds, the market continued to make forward progress. It wasn't convincing progress, and slowed down when the indices approached record-high territory. But, it was a gain nonetheless. Traders are giving stocks the benefit of the doubt.
This week will be another big test, at a time of year when stocks don't typically perform well. They're already going against the grain in that regard, thanks to some encouraging chatter on the trade-relations front. It remains unclear if the chatter itself is the only thing driving stocks higher than they are already. The economic backdrop is pretty good as-is.
To that end, we'll take a look at the key economic data before we start dissecting the broad market. There's a lot to add to the backdrop.
Economic Data Analysis
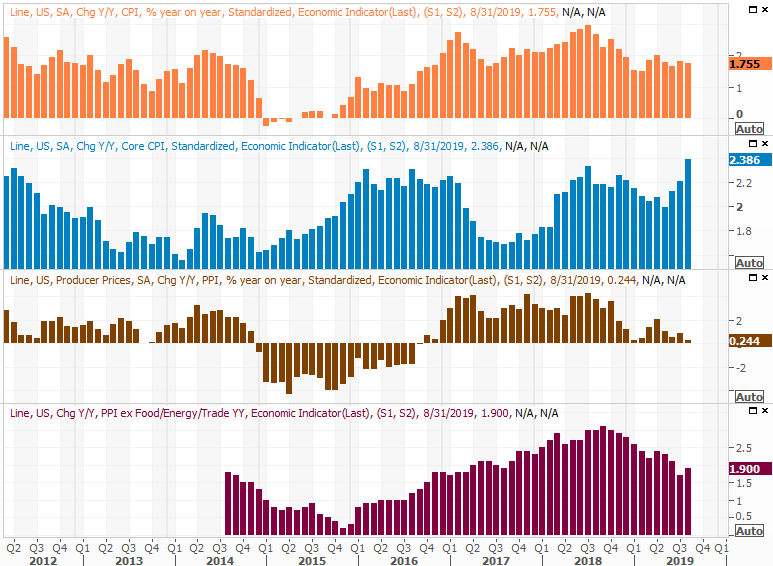
Last week was a busy one, though not a great number of last week's announcements were hard-hitters. In fact, only two sets of data stood out… last month's inflation information, and last month's retail sales. The inflation information is particularly important headed into this week, as the FOMC will be making a decision about interest rates on Wednesday.
In short, despite low interest rates, inflation remains tame. Core consumer inflation (not counting food and energy price increases) popped, but even at 2.39%, that's manageable. Those price increases are also being offset by lower prices of other goods, though even then, August's price hikes feel like something of an anomaly. Also notice that the nation's factories and production plants are seeing practically no inflation to speak of.
Consumer, Producer Inflation Charts
 [2]
[2]
Source: Thomson Reuters
The other biggie was retail sales. They were solid, suggesting consumers aren't sweating anything, and explaining the underlying demand that ratcheted consumer prices higher. Overall retail sales were up 4.6% year-over-year, improving for a third month in a row.
Retail Sales Growth Charts, Year-Over-Year
 [3]
[3]
Source: Thomson Reuters
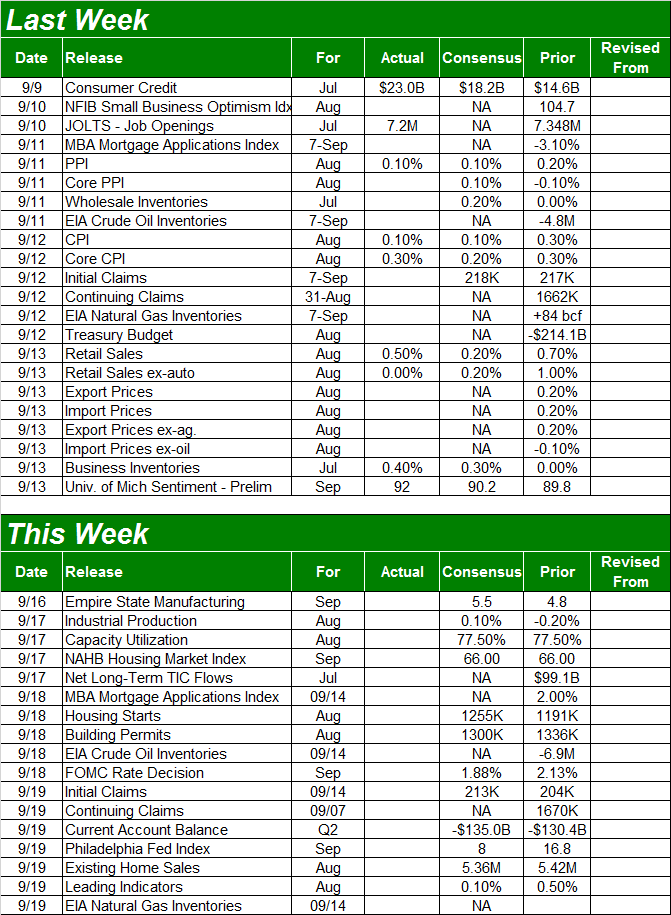
Everything else is on the grid.
Economic Calendar
 [4]
[4]
Source: Briefing.com
This week is going to be busier, with the centerpiece of the week being the Federal Reserve's call on interest rates due on Wednesday. The Fed's governers have most recently hinted there's no immediate need to push rates lower, and they have no desire to do so this time around. Nevertheless, the market has priced in an 80% chance that the Fed Funds rate will be sent lower by a quarter of a point.
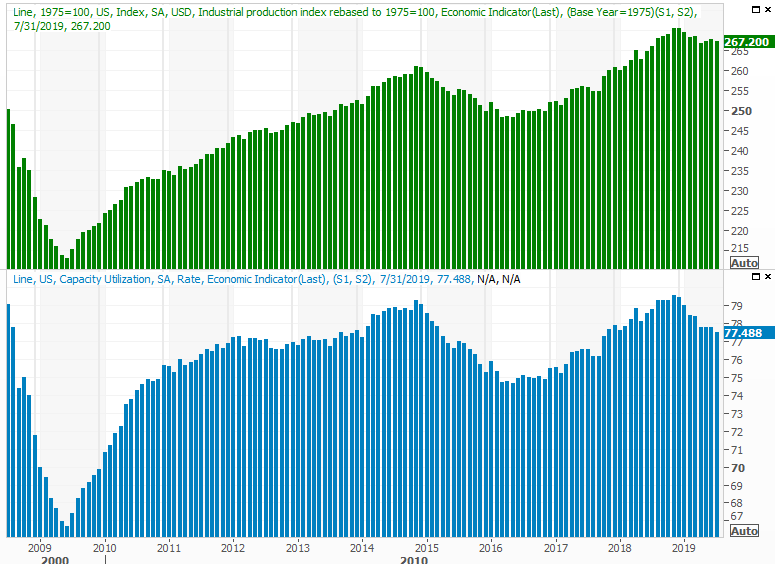
Before that, on Tuesday, we'll get another important data nugget that most people tend to ignore… the capacity utilization and industrial production information for last month. Both fell a month earlier, extending something of a lull. The pros are looking for right around the same numbers this time around.
Capacity Utilization and Industrial Production Charts
 [5]
[5]
Source: Thomson Reuters
The market's overall earnings tend to move in tandem with the production and capacity utilization data, although it's clearly long term data.
Also on Wednesday look for August's housing starts and building permits. Both have been stagnant, and while lower mortgage rates might have made a dent on this front, economists aren't calling for one.
Housing Starts and Building Permits Charts
 [6]
[6]
Source: Thomson Reuters
Finally, though it's only half the data set, on Thursday look for last month's existing home sales. Forecasters predict a slight dip from last month's tally, though not so much that the broader (albeit uneven) uptrend will be broken. This has been the real estate market's bright spot, implying prices and transactions and starts/permits can't rise indefinitely together.
New, Existing Home Sales Charts
 [7]
[7]
Source: Thomson Reuters
August's new-home sales data will be posted next week, rounding out the look.
Stock Market Index Analysis
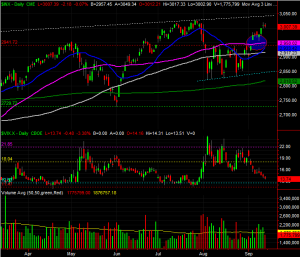
Three weeks ago, the market was hanging by a thread. The S&P 500 had just bumped into a well-established technical ceiling that extends back to the early 2018 peak from just a few weeks prior, and was seemingly taking aim at support from the 200-day moving average line.
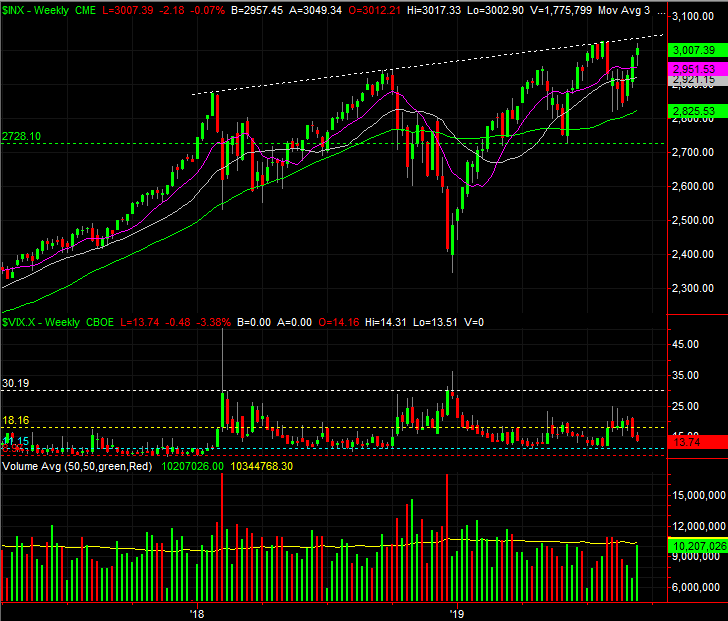
Then, all it took was a little nudge to put the bulls back into action. They were looking for a reason to see the glass as half full rather than half empty, but it worked. As the weekly chart shows, the S&P 500 is almost backo the technical ceiling plotted as a white dashed line.
S&P 500 Weekly Chart, with VIX, Volume
 [8]
[8]
Source: TradeStation
It's a very flawed effort though, for more reasons than one.
Chief among those flaws is the fact that the VIX is once again back to unusually low levels. It's not yet back to an absolute low around 11.2, but it's getting close at the same time the S&P 500 has moved to within 30 points of the upper boundary, currently at 3040. That distance is enough — and enough time — for the VIX to go ahead and fall all the way back to the 11.2 area and then dish out the near-perfect reversal.
Another concern regarding the uptrend is the big gap that was left behind by the big gain from September 5th, highlighted on the daily chart below. Broadly speaking, traders don't like to leave gaps unfilled. That doesn't necessarily have to happen straight away though. The index could conceivably move to the 3040 mark first and then slide back to fill in the gap. That move, however, could mean enough bearish momentum is allowed to develop to finally crash below the floors that haven't broken down yet. That's most likely to be the 200-day moving average line (green), when all is said and done.
S&P 500 Daily Chart, with VIX, Volume
 [9]
[9]
Source: TradeStation
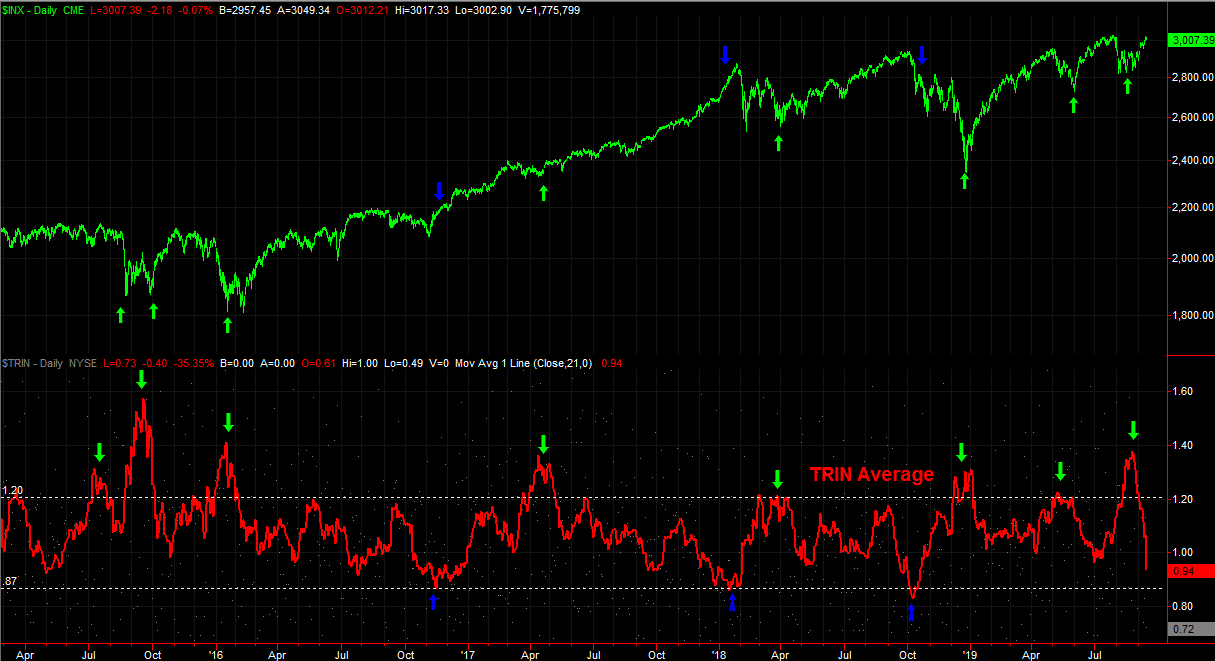
To that end, the TRIN index we pointed out a couple of weeks ago (https://www.bigtrends.com/stocks/a-stock-showdown-is-coming-this-week/) was 'too high,' suggesting a bounce was nigh, has almost moved all the way back to the other end of the spectrum to reach 'too low' levels that would normally coincide with a market top. But, like the VIX and the S&P 500 itself, it's not quite to the tipping point yet.
The TRIN data, or Arms Index, in simplest terms is a comparison of the market's bullish and bearish volume and the market's advancers and decliners. The ideal reading for the Arms Index is in the middle of its normal trading range, as that allows for trends to be sustained in a so-called Goldilocks scenario … not too hot, and not too cold.
When breadth and depth become mismatched though, that eventually leads to reversals that are largely unexpected. Take a look at how the S&P 500 usually reversed course when the moving average of the daily TRIN data moved to an extreme. The rally that's taken shape over the past three weeks was accurately signaled by a TRIN reading that moved far too high.
S&P 500 Daily Chart, with TRIN (Arms Index) Moving Average
 [10]
[10]
Source: TradeStation
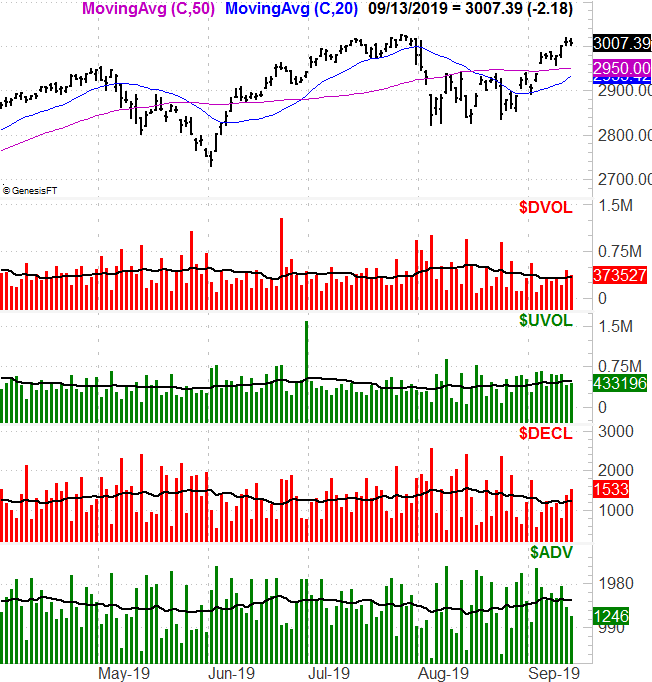
In that light, notice that despite last week's gains, the NYSE's bearish volume and decliners appear to be trending higher, while its bullish volume and advancers have been tapered off. This advance isn't nearly as healthy as the gain itself would suggest.
S&P 500 Daily Chart, with NYSE Breadth and Depth
 [11]
[11]
Source: TradeNavigator
That's not to suggest the breadth and depth tide won't turn back for the better if and when the S&P 500 manages to break above the resistance at 3040. Anything's possible. But, such a move would only accelerate the arrival of a correction, and the speed at which it materializes. Pacing will be the key if that move is to last.