
There's still a glimmer of hope for stocks, but only a glimmer. All of the major market indices are at or near a major technical floor, with no apparent interest in moving away from that danger. And yet, traders don't seem scared enough yet to say a bottom has already been put in.
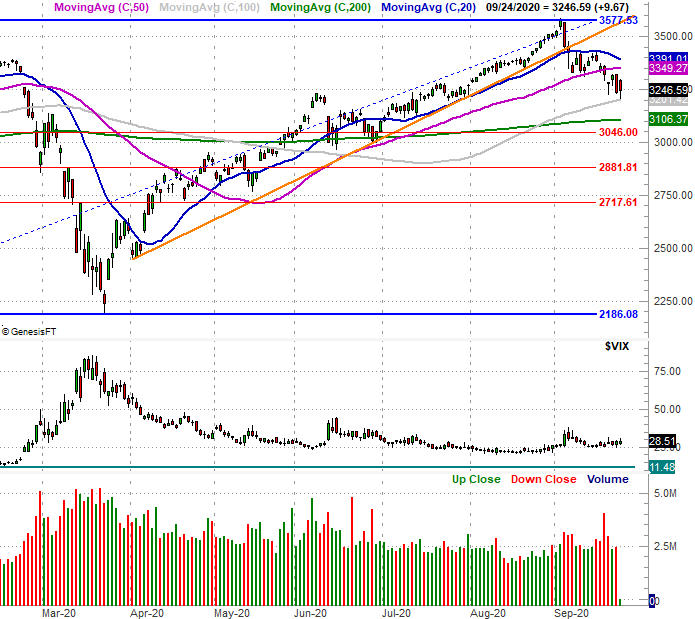
It's all readily evident on the daily chart of the S&P 500. Thursday's low of 3209.45 is within striking distance of the 100-day moving average line (gray) at 3201.4. While it didn't slide under that line today, the index did log a new multi-week low, and it did peel back from what looked like was going to be a solid reversal effort from Wednesday's steep selloff. The shape and size of that day's selloff, in fact, was something of a message – don't stand in the sellers' way.
 [1]
[1]
Perhaps the most concerning aspect of the S&P 500's daily chart, however, is what didn't happen. The S&P 500's Volatility Index, or VIX, didn't shoot higher despite the fact that stocks are clearly on the defensive. Most market bottoms tend to coincide with a clear spike in that so-called fear gauge. The fact that not many traders are showing much worry right now suggests they may need some more selling to induce what's ultimately a healthy level of panic. See March and even June for examples.
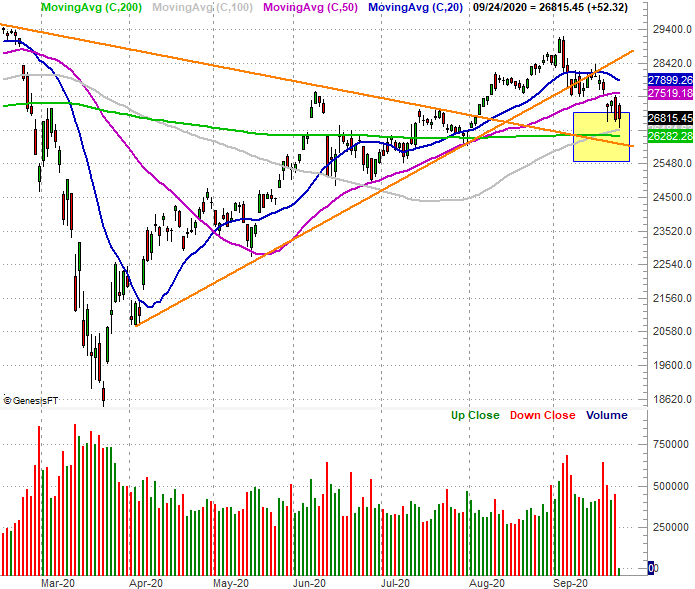
It's not just the S&P 500 teetering at major technical floors, however. The Dow Jones Industrial Average – something of a bright spot for the broad market – is also nearing its 100-day (gray) as well as its 200-day (green) moving average; the former just crossed above the latter. Breaking below that floor around 27,000 is a red flag, but the impending cross of the 20-day moving average line (blue) below the 50-day line (purple) would also flag more downside.
 [2]
[2]
That's not to suggest it would all happen in one fell swoop. In fact, it probably wouldn't happen like that. More realistically, it would require a little more back and forth between the 100-day and 50-day moving average lines to break the technical floor in question… volatility that would also give the bulls a chance to regroup and break technical ceilings instead. Given the backdrop of a contentious presidential election, ongoing uncertainties about COVID-19, and so much profit-taking potential for big, popular, large cap tech names though, it's the sellers that have the edge here.
Speaking of large cap technology names, the NASDAQ Composite's story is unfurling much like the S&P 500's and the Dow's. The 20-day and 50-day moving average lines are in the rearview mirror, and the 100-day line (gray) is dead ahead. Like the S&P 500's Volatility Index, the NASDAQ's Volatility Index – the VXN – is also strangely suppressed.
 [3]
[3]
The composite is giving us one big clue the other two charts aren't though. Thursday's low of 10,520 is basically in line with Monday's low. There's something about that line in the sand. Should the composite fall under it, that's an omen of trouble. Should the NASDAQ also break below its 100-day line at 10,363, that's an even bigger red flag… particularly of the other two indices follow suit.
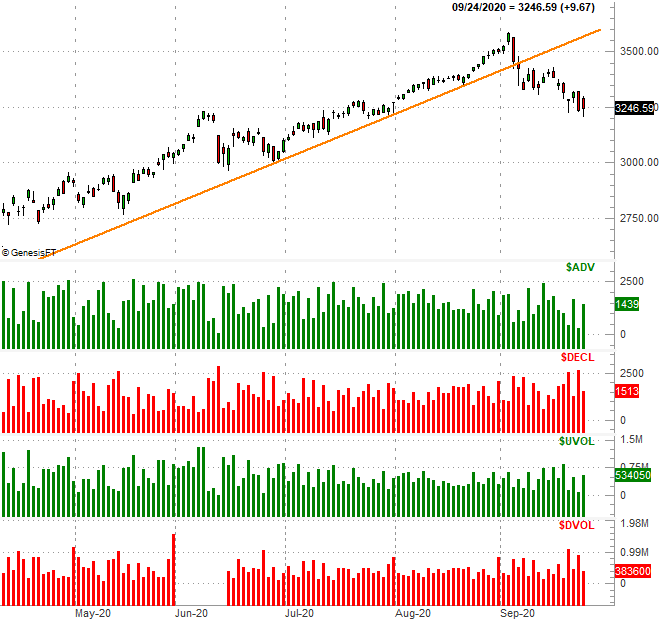
And then there's the aspect of this market you're probably not seeing… breadth and depth. That is to say, how many stocks are rising and falling, and how much volume is there behind those gains and losses?
The chart below answers both questions, using the NYSE's advancer and decliner numbers and its daily up-volume and down-volume numbers. While still erratic, the daily up volume and advancers are starting to trend lower. The NYSE's bearish volume and decliners are starting to trend higher. The sellers have the bigger army right now.
 [4]
[4]
Never say never, of course. Anything could still happen from here. Wednesday's drubbing was pretty deflating though, and Thursday's tepid effort to turn things around only underscored how little conviction the bulls have at this point.