Wal-Mart Stores (WMT) Shares Teetering On the Verge Of a Breakout
From a consumer's perspective, it's still one of the nations and the world's most despised companies, but from an investor's perspective, Wal-Mart Stores (WMT) may have quietly turned into a decent buying again IF one last hurdle can be cleared.
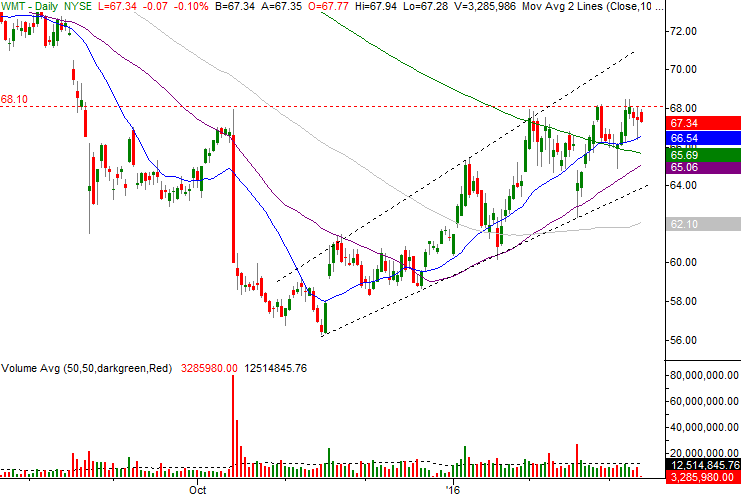
Last year was, to put it bluntly, a miserable one for Wal-Mart owners. The stock peaked at $90.97 in January of 2015, and spent the rest of the year making a beeline to the November low of $56.30.
A funny thing happened right before WMT shares completely fell off the edge of a cliff – the bulls started to nibble again, and have not only quietly yank the stock out of a downtrend, but have established a promising uptrend. If Wal-Mart shares can just clear the technical ceiling at right around $68.08, such a move may well unleash more of the kind of buying we've seen since December.
The daily chart tells the tale. From a technician's perspective, the advance has been a consistent and well-supported one. Namely, the 50-day moving average line (purple) and the 20-day moving average line (blue) have both acted as support levels, setting up a string of higher lows and higher highs that have formed a decisive bullish channel end and of themselves. More recently – and perhaps even more telling – WMT shares have heard old the critical 200-day moving average line (green), and in the meantime have continue to find support at the 20-day moving average.
 [1]
[1]
The ceiling around $68.08 is also well defined, enough to be trifled with. Wal-Mart shares peaked there in October, struggle there in early February, stall there again in late February, and have been hitting a wall there for the better part of the month of March. Clearly there's something about that level, even if it's only a psychological burden now.
Nevertheless, if the stock can make its way above that resistance line, there's not a lot left to get in the way of the bigger-picture uptrend presently underway. The next ceiling is the upper edge of the intermediate-term trading range (black, dashed) that extends back to the November pivot. It's currently at $71.00, but by the time the stock could even test it, it would be closer to $73.00.