Over the course of the past few weeks we've followed the demise of the U.S. dollar, largely predicting it would pull back even when most others were expecting it to recover as U.S. interest rates were rising. Our thesis was, in simplest terms, the greenback erroneously rallied in 2014 and 2015 — when interest rates weren't really rising — and was still far too overbought to rally again on the increase in interest rates that's unfurling now.
We're glad we stuck with our minority opinion. The U.S. Dollar Index is now down 14% from its December-2016 peak. That's not a lot by market or stock standards, but its huge by currency standards.
We have good reason now, however, to think the U.S. dollar is bottoming. And if we're wrong, then look out below because then the dollar's is big-time trouble.
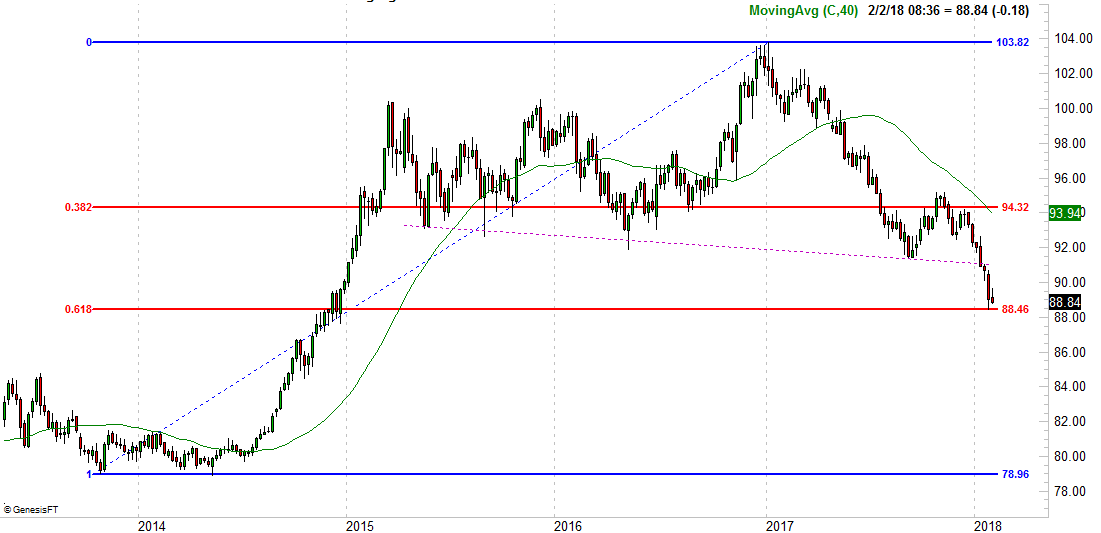
The graphic below is a weekly chart of the U.S. Dollar Index going all the way back to 2014's low. The rally from 79 then to December-2016's high near 104 is not only clear, that span serves as the basis for our rationale that the dollar itself just found a floor.
 [1]
[1]
The crux of the not-bearish-anymore argument lies in the horizontal lines plotted across the chart of the dollar. They're Fibonacci retracement lines.
You know what they are, even if you don't think you know. Think back to your high school (or maybe middle school) math; they may have been referred to as the 'Golden Ratio.' The principal is the same though. That is, two quantities are in the golden ratio if their ratio is the same as the ratio of their sum to the larger of the two quantities, which sets the stage for spiraling — literally and figuratively — patterns that reflect the fractions 1/1, 2/1, 3/2, 5/3, 8/5, 13/8, 1/1, 1/2, 2/3, 3/5, 5/8, 8/13, and so on. In terms of decimals, these numbers are 0.38, 0.62, 1.38, 1.62 and so on.
Mathematician Fibonacci noticed these fractions (and their core components of 5, 8 and 13) were also observed frequently in nature. Flower petals, for instance, often grow in multiples of those numbers. Tree branches, amazingly enough, often number no less and no more than 13. The growing spiral shape of a sea shell's segments, when measured, exhibit the aforementioned fractions. It's just a naturally-occurring mathematical phenomenon…
… which may well apply to the trading world as well.
Some people — many people, to be fair — scoff at the idea. Applying something as a coincidental as a mathematical oddity to a chart simply makes no sense, in that a stock's or index's value is driven by far too many ever-changing factors. We don't disagree either. Still, bearing in mind that it's far from infallible and certainly not etched in stone, Fibonacci lines can tell us a lot about the market's underlying psychology. See, broadly speaking, traders unconsciously have the tendency to let a chart fall about 38% from a peak after a rally from a clear bottom. And, if the selling doesn't stop at the 38% retracement level, then a 62% pullback is likely to take shape.
Now, with that in mind, take a another look at the long-term chart of the U.S. Dollar Index, with its Fibonacci lines. The 38% (38.2%, to be exact) retracement line didn't stop the selling back in July, but the 62% (61.8%, actually) retracement line seems to be playing a support role now. That's where the greenback hit bottom last week. It's not been under it since then.
[1]
It's absolutely nothing you'd want to bet the farm on, so to speak. It's just one tool of many you'd want to respect, knowing you may get conflicting messages from other trading tools. It's a tool that certainly helps though, offering context often when there is none.
There's certainly no guarantee the dollar can't or won't move below the 61.8% retracement line at 88.46. There's a head-and-shoulderish pattern, in fact, that suggests more downside is likely now that the neckline (purple, dashed) has been broken.
It's something to watch all the same though, because when all is said and done, while scenarios and situations change, investor psychology never changes. That's what these Fibonacci lines ultimately show… where traders reach their "enough is enough" limit.
We'll update as necessary. In the meantime, know that a rising dollar is bad for oil and gold prices.