
A little over a week ago we pointed out the U.S. dollar was in a dangerous freefall [1] that would reach a fork in the road sign. It got there today. That is, the U.S. Dollar Index hit a low of 93.15 today, reaching a key support level that's marked several major lows since mid-2015.
The greenback bounced as a result, as is presently trading at 93.9 with a ton of room to keep rolling higher should traders want to make it happen. It's far too soon to assume a prolonged bounce is in the cards though. A floor that's been support in the past is where at least some bulls draw a line in the sand though, so it wouldn't be surprising to see a bullish pushback. Indeed, it would be surprising if we didn't see some pushback. The question is, is the pushback going to last long enough to set up a bigger recovery move?
Only time will tell, but it shouldn't take a lot of time to get an answer from now.
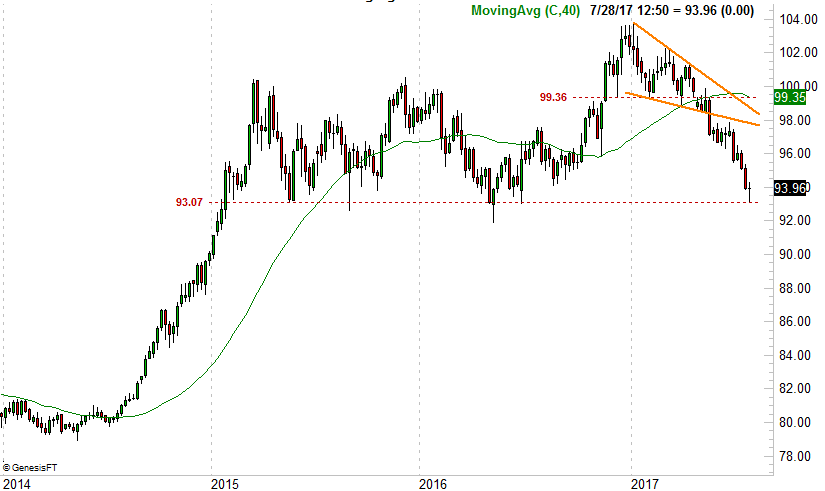
The weekly chart of the U.S. Dollar Index below puts things in perspective. The 93.1 level isn't the absolute low since 2015, but it has been the key low more than any other level has for the timeframe. Add another instance to that list of 93.1 being a key low.
 [2]
[2]
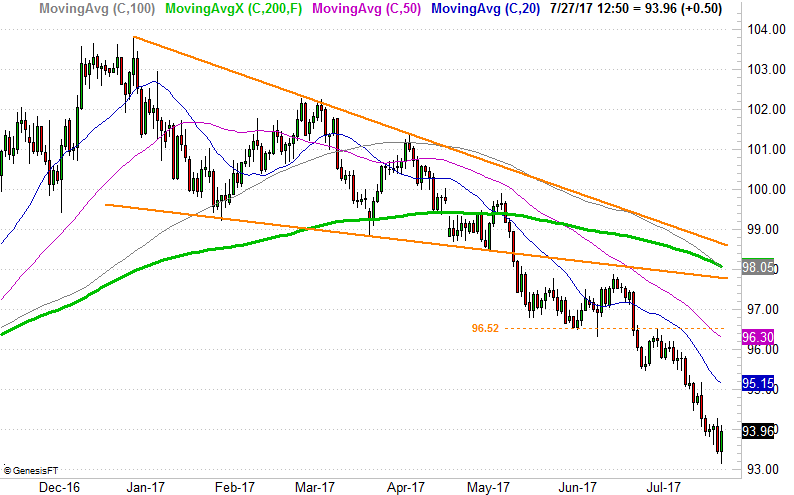
Here's the zoomed-in, daily version of the same chart. It's in the timeframe we can see how firm Thursday's intraday reversal has been following Wednesday's sharp move to multi-week lows.
 [3]
[3]
As was noted, Thursday's bounce sets the stage for a potential rebound, fueled by the sheer scope of the selloff since May… when the index broke under the lower boundary of a falling converging wedge pattern (framed in orange). Thing is, even a sizable snap back towards a developing entanglement of resistance around 98.0 — where the 100-day and 200-day moving average lines are about to intercept the some lower edge of the wedge pattern — wouldn't actually break the downtrend. The undertow is still working against the value of the U.S. dollar.
The undertow is the Federal Reserve, of course. The FOMC had been relatively hawkish as 2016 became 2017, but after a couple of rate hikes the Fed has backed off on the planned pace of rate increases. At one point the odds called for two more rate hikes this year. Now those same odds suggest we won't get the next 1/4 point hike until March.
And why not? Though inflation was getting a little bit frothy a few months ago, it's now cooled off. The current annualized consumer inflation rate stands at 1.63%. That's markedly lower than February's level of 2.74%, meaning the Federal Reserve isn't forced to do anything just yet.
Be that as it may, the make-or-break line is still 93.1 for the U.S. Dollar Index. The dollar can waffle all it wants above that line with little to no impact. Should the floor at 93.1 fail to hold the currency up though (no matter when it happens), that breakdown is likely to start a selling chain reaction that really does some damage to the greenback.
That's not inherently bad for stocks, in that a weaker U.S. dollar makes it easier for U.S. companies to sell their goods overseas. It's also great news for oil companies. It also makes bonds and gold more valuable though, which does ultimately work against equities. The question is one of degrees… how rapidly might the U.S. dollar unravel if things go from bad to worse. The market may shrug off a slow meltdown, but if it's a quick one, look for volatility in all corners of the investment arena.