Stocks as a whole are still on the fence. And, perhaps for the best, Tuesday's tumble is forcing the bulls as well as the bears to make commitments to their stances. We don't have a lot of certainty about things just yet. In fact, we got quite a mixed message during Tuesday's action. That's a good thing though. We now know what to watch, and where to watch.
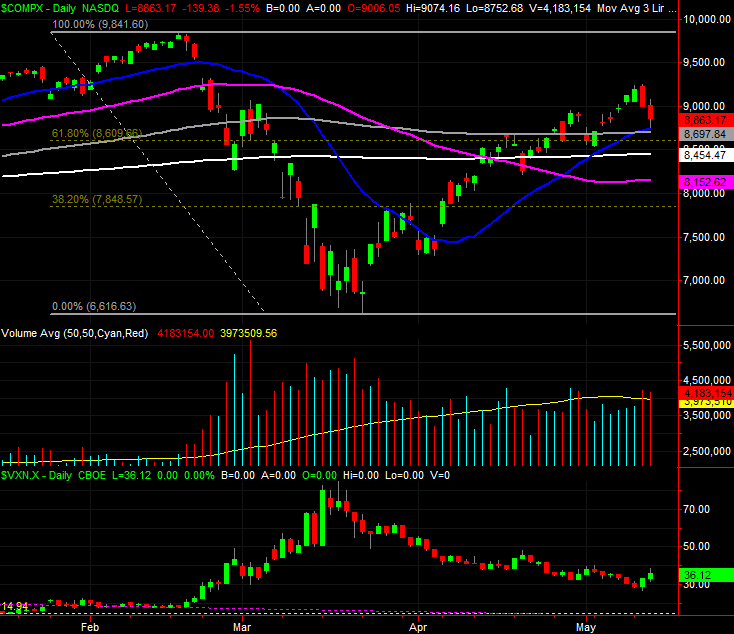
The NASDAQ Composite was a relative winner. Although it ended the day down to the tune of 1.55%, it also ended the day above an important intraday low. Its low of 8752.68 was right where the 20-day moving average line (blue) is. That's a critical make-or-break line made even more critical by the fact that it's crossed back above the 100-day moving average line (gray). Perhaps best of all, the FANG stocks — which are overwhelmingly represented within the composite — didn't suffer the brunt of the damage nor do the bulk of the recovery work. This was a move all these names contributed to, for better or worse. (The biggest names in the index had been leading the way, without the participation of all these tickers.)
 [1]
[1]
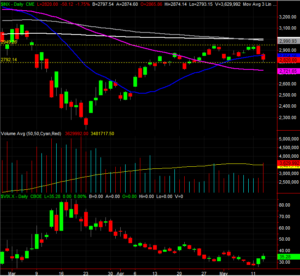
Curiously, the S&P 500 didn't mirror the move. That is to say, the index didn't quite push up and off of its intraday low of 2793.15, letting it end the session lower by 1.75%. And, perhaps more alarmingly, that close of 2820.0 was below the S&P 500's 20-day moving average line (blue) at 2854.16. The large cap index has yet to even test its 100-day (gray) and 200-day (white) moving average lines as technical ceilings. Most curious of all, though, is the fact that we saw a ton of volume behind the S&P 500's pullback… but it didn't come from the very biggest names. It was made by several tickers, many of which are the smallest 90% to 95% of the index. Participation is good, but the bulls would prefer to see more participation on the way up rather than the way down.
 [2]
[2]
Still, the S&P 500 has done us the favor of confirming where a couple of big lines in the sand are. There's a key ceiling around 2949, where the index has peaked twice, and a big floor at 2792 where the S&P 500 has found a floor a couple of times in the past couple of weeks. These zone is plotted with yellow dashed lines on the chart, although it's still a zone within a zone. The S&P 500's biggest resistance is the convergence of the 100-day and 200-day moving averages at 2991, and the 50-day moving average line (purple) at 2721.65.
This doesn't really tell us anything yet, but it's an important day all the same. Conviction is finally being tested, and it's being tested in the places where it would be most expected. It could take several more days for traders to figure out what they truly want to do here, but we're starting to get a much-needed roadmap as the market shows us its make or break levels.