Tuesday's jaw-dropping losses might have looked and felt like pure, unbridled insanity. And, perhaps there was a dash of that in the mix. By and large though, most of Tuesday's action made a lot of sense. The move pushed the indices to the brink of a complete meltdown, but curiously, the selling stopped just short of levels that would truly open the selling floodgates.
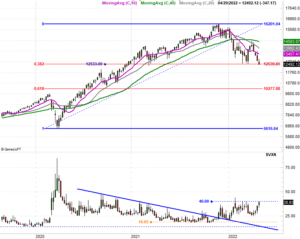
This is most evident on the weekly chart of the NASDAQ Composite. Take a look. Tuesday's low (and close) near 12,492 is right in line with March's low. More than that though, the tumble brought the NASDAQ exactly to a practically-perfect 38.2% Fibonacci retracement of the rally from the March-2020 low to the October-2021 high. This is exactly where you'd expect the bulls and buyers to make a stand rooted in the psychology of "this dip has taken away all it feasibly can."
There's another curious detail evident on the weekly chart of the NASDAQ as well. See the volatility index – or VXN – at the bottom of the chart? It bumped into a pretty important technical ceiling around 40, where it was capped in March.
Yes, the VXN's current ceiling and the NASDAQ Composite's current floor were first established at the same time, and are being simultaneously tested now. It just so happens that the composite's floor is also a key Fibonacci retracement line. It's not likely any or all of these are mere coincidences.
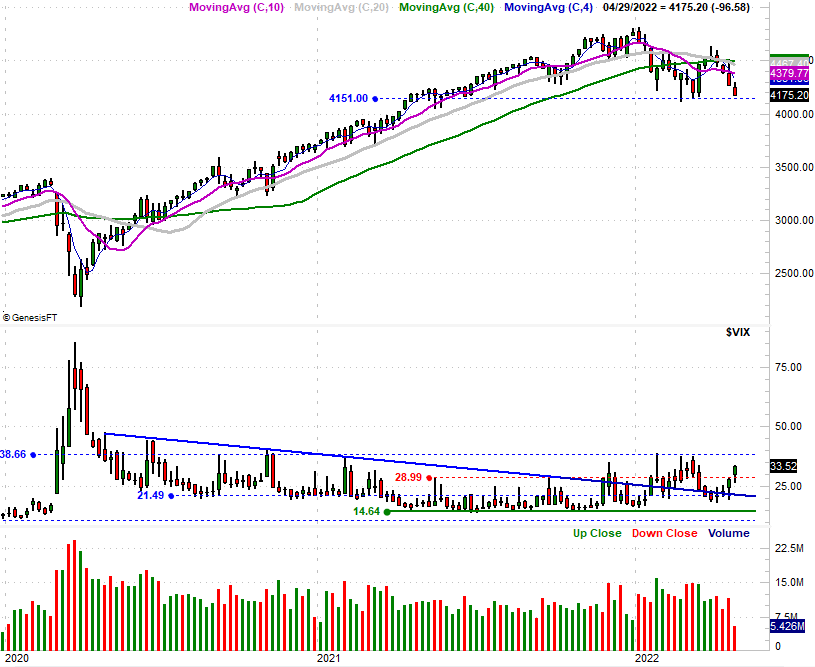
The S&P 500's chart is similar, although not identical. The index hasn't peeled back to a 38.2% retracement level, nor has the S&P 500's volatility index – or VIX – tested a major technical ceiling; that won't happen until it moves back to 38.5. The S&P 500's close of 4175 on Tuesday, however, does essentially leave it at March's lows without actually dragging it below that floor.
 [1]
[1]
Again, not a coincidence.
The one good thing about Tuesday's steep selloff is the sheer size of it. It was so bad that odds are good we'll see a dead-cat bounce on Wednesday. Just don't read too much into it if that happens. The indexes will need to fight their ways back to some serious technical resistance lines, and then push through them, before declaring the market back in bullish mode. There's a lot that could pull the rug out from underneath stocks in the meantime.
For the S&P 500 the first of those ceilings is the 50-day moving average line at 4397.5, although there's a layer of resistance all the way through 4503. For the NASDAQ Composite, resistance lies all the way between 13,604 and 14,648.
 [2]
[2]
It bears repeating: A bit of firm bullishness on Wednesday and even through Thursday doesn't necessarily prove anything. Such a move may only set up another wave of selling that drags the indices below the floors that came back into play on Tuesday. We'll just have to wait and see how it all plays out.