
Stocks suffer setbacks all the time. Many of them are to no avail. Thursday's setback, however, means more than it may seem on the surface.
That's not necessarily a conclusion you would draw from the numbers alone. The S&P 500 fell nearly 2.4% in Thursday's trading, but we've seen worse, and recently. Some of those big stumbles were an omen of more selling. Some weren't. Thursday's stumble is a sizable red flag though, for one clear reason.
But, first things first.
Not all investors care much about charts, suggesting a chart's history says nothing about a stock's future. While that's not a stance we agree with, it is one we understand. If you expect reading a chart to be easy, or consistent, you're expecting too much. Using a chart's history is only an odds-making tool about that stock's future price, as stocks tend to behave the same over and over again.
Be that as it may, there's one aspect of charts that even the staunchest critics of technical analysis can't deny. That is, a chart is a historical log of the market's sentiment of ever-changing daily opinion of a stock's value, and psychology is a credible science.
With that as the backdrop, Thursday's selling is more than just one bad day because with the setback, the benefit of the doubt the market was giving the market was decidedly shattered.
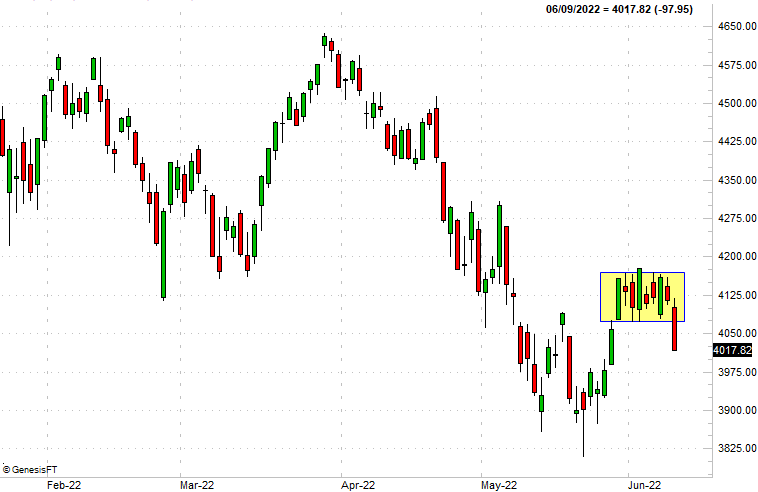
The benefit of the doubt comes in the form of a break below the lower boundary of a "box" the S&P 500 had been trapped in since late May, framed in yellow on the chart below. With a floor at 4072 and a ceiling at 4170, investors were content to sit on the fence for eight consecutive days following the late-May bounce. More specifically, investors weren't willing to sell stocks during this period out of fear the bullish reversal might be going somewhere, even though they weren't willing to buy stocks in earnest either. With Thursday steep selloff though, investors are no longer willing to support prices they were willing to support for the better part of the past couple of weeks.
 [1]
[1]
What changed (aside from confidence)? It's not a stretch to say nobody wants to be left holding the bag for Friday's look at May's inflation figures. Most everyone understands they'll be high. It's just a question of how high. The fact that the majority is no longer willing to take the risk they were willing to take just a day earlier, however, also indicates there may be bigger doubts brewing beyond mere worries about Friday's consumer inflation report.
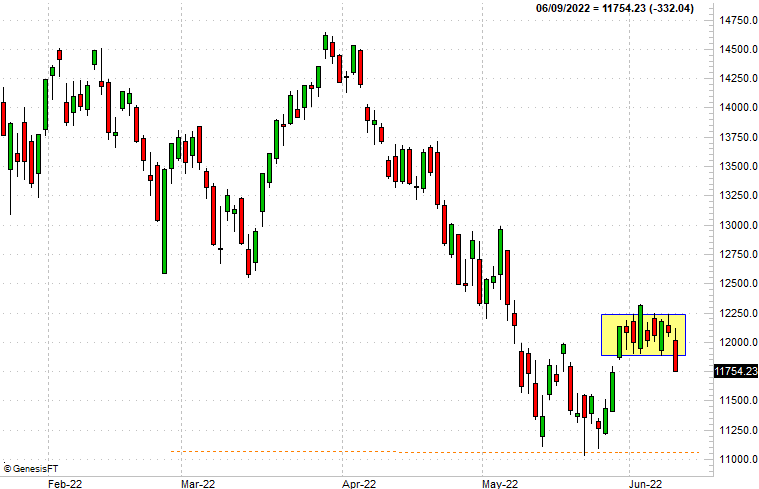
And for the record, the daily chart of the NASDAQ Composite is telling us the exact same thing, underscoring the idea.
 [2]
[2]
And it IS just that… an idea.
In some ways the anti-charting crowd is right. Charts aren't crystal balls, offering up a clear picture of what's about to happen. They're tools, subject to interpretation and differing opinions. It's entirely possible Thursday's selling isn't a warning at all (There's no denying the market's been exceptionally volatile and inconsistent of late.)
Both of the charts above to show us something to bear in mind from here, however, particularly if you've been refusing to entertain any bearish doubts and have been blindly bullish. At the very least this is a red flag that's too important to ignore.
That being said, before plowing into bearish trade, you should also know one day doesn't make a trend. It just starts one. It will take a couple of days at least for any budding pullback to confirm itself as such. Ideally, the bulls will actually push back a little but fail to push the indices back inside their "boxes" before the sellers dig in again. If that happens, the threat level gets ratcheted up a couple of notches.