
By Mark DeCambre, MarketWatch
Has the stock market hit rock bottom after a rough October?
According to at least one technical analyst, the worst is over for U.S. equity benchmarks after an October that chopped substantial year-to-date gains from the S&P 500 index and the Dow Jones Industrial Average and knocked the Nasdaq Composite Index into correction territory, usually described as a decline of at least 10% from a recent apex, for the first time since 2016.
John Kosar, the chief market strategist at Asbury Research, says the ratio between bullish and bearish bets via options on the S&P 500, in recent history, has offered one of the clearest signals that a bottom in the market has been achieved. He says an increase of put volume compared against call volume is reversing from a level that indicates maximum bearishness to one that represents a more upbeat outlook for Wall Street equities.
Put options grant the holder the right, but not the obligation, to sell a stock at a given price and time and tend to be used as bearish bets, while call options, which grant holders the right to buy an asset, tend to be used as a reflection of a bullish outlook.
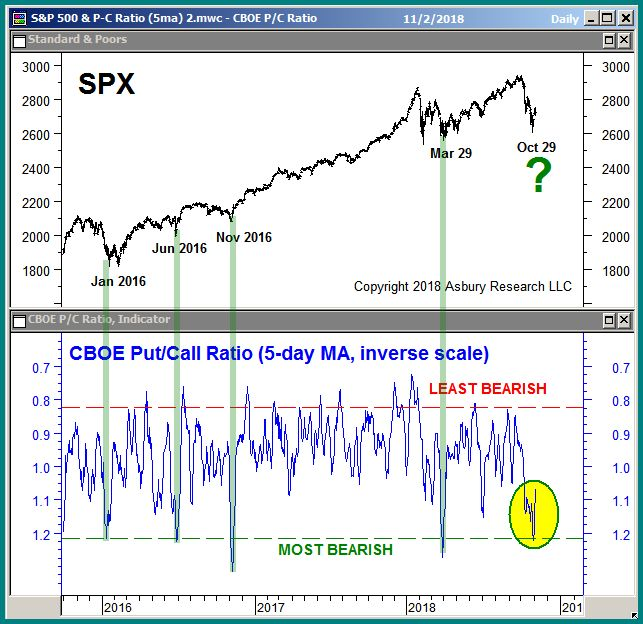
Kosar’s chart, representing moves in the S&P 500 over the past two years, illustrates that when bearish extremes have been achieved in put/call ratios then a sharp swing higher in the broad-market benchmark usually follows, as it did in January, June and November of 2016 as well as March 29 of 2018, the market technician points out (see chart below):
 [1]
[1]
From MarketWatch [2]