A week ago when we took a look at the third quarter earnings results to date, we were pleased to see the collective numbers rolling in better than it seemed they would as of mid-October. At the time, the S&P 500 was on pace to report a Q3 bottom line of $31.79, up from the likely $31.66 the pros were calling for shortly into the third quarter earnings season.
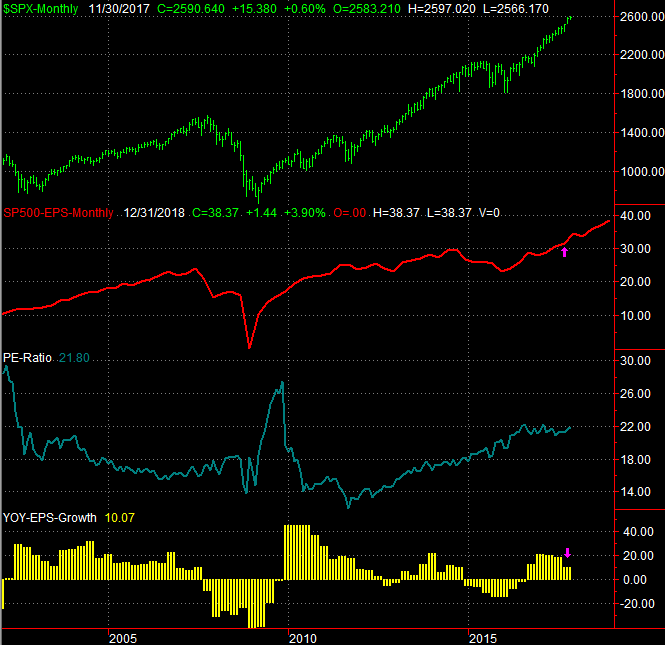
In retrospect, we're wishing we would have just left well enough alone. With 84% of the S&P 500's constituents having reported their Q3 numbers, the index is expected to report a final profit of only $31.58 per share. The fourth quarter outlook was dialed back a few cents as well. The pink arrows point to where we are right now; click on the chart to see the full-sized image.
 [1]
[1]
With the newer numbers in hand, the S&P 500 is now trading at a trailing P/E of 21.8 and a forward-looking P/E of 18.5. Both are above long-term norms, with traders ignoring the relatively tepid results and focusing on — perhaps betting on — strong economic growth going forward (perhaps even without President Trump's tax overhaul plan being enacted). Of course, analysts are still projecting impressive earnings growth in 2018; investors are just following their lead, right or wrong.
Whatever the case, the third quarter earnings season was and still is about individual sectors rather than the broad market, as we're seeing wide disparities in each group's results. In particular we're interested in the energy sector's bottom line, which is doing leaps and bounds better than it was a year and a half ago, but is still doing relatively poorly in the grand scheme of things — and making the overall market feel more expensive than it actually is.
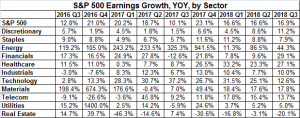
This is a two-component idea, the first of which is a year-over-year comparison of each sector's earnings growth. The table below tells the tale.
 [2]
[2]
Don't get too excited about the energy sector just yet. The comparison is impressive, but the bar was set very low. For the third quarter, the S&P 500 Energy Sector Index has earned $3.70 per share versus only 87 cents per share in the third quarter of 2016. Thing is, the index was earning in excess of $10 per share before the 2014 meltdown.
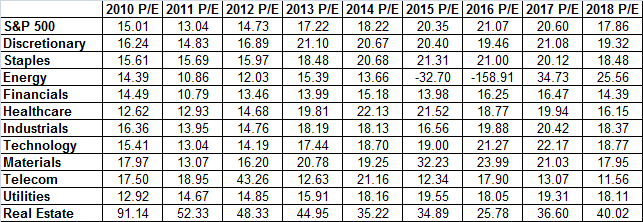
Here's the second dimension…. each sector's trailing and P/E ratio and forward-looking P/E ratio. With three of the year's four quarter's out of the way, the energy sector is still trading at 34.7 times 2017's likely income compared to a P/E in the low-teens from just a few years ago.
 [3]
[3]
Thing is, almost ALL sectors are well above their long-term normal P/E levels. Even the financials are trading at above average valuations. Ironically, the telecom sector is the cheapest group right now and is expected to grow its bottom line pretty nicely over the course of the next four quarters. Yet, the telecom sector's stocks have been absolutely hammered of late. At the other end of the spectrum are staples and discretionary stocks, which aren't growing earnings very well but have been pushing higher anyway …. well into uncomfortable P/E levels.
The discussion raises at least one question that's particularly prescient right now — do P/E ratios really matter? The popular answer right now is no, they don't, especially when interest rates are low as they are right now. That's a salesman's answer though. One, rates really aren't that low any longer (and they're rising), and two, the market's current valuations weren't justified a few years ago when interest rates were even lower than they are now. The "low interest rate" argument is the average investor's way of justifying their bullishness right now, resting on mere hope that the rally isn't over yet.
Perhaps more important, though P/E ratios may not matter, they will matter again at some point in the future, and they'll start to matter again in a hurry without any warning.
Whatever the case, it's pretty clear that earnings growth outside of the energy sector wasn't very compelling last quarter with the exception of the technology sector. In light of their earnings growth rates, the P/E levels are palatable. Not so with anything else.
Other key takeaways? Financials are attractive, discretionary stocks aren't actually worth the trouble, healthcare remains unimpressive despite loft expectations, and industrials are a relative value here as well.
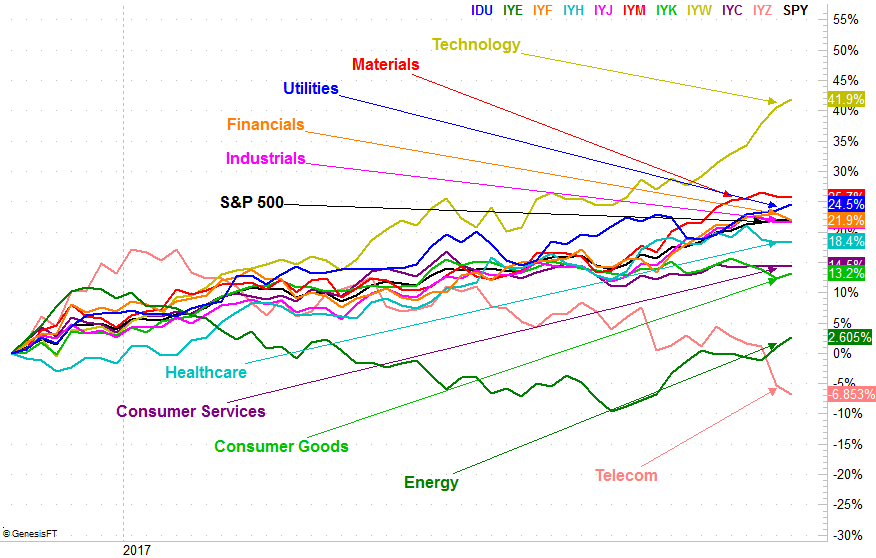
With that as the backdrop, the performance comparison chart of each sector going back the past twelve months means a great deal more. Though tech stocks are technically overbought, traders had a relatively good reason to get excited about buying them. On the flipside, the trashing of telecom stocks makes little fundamental sense, but the end result is a deeply undervalued sector. We can also see that though energy stocks are severe laggards for the year, the recent earnings season has finally convinced investors these names are over the hump. Curiously, the utility sector – which has value and earnings growth (even if uneven) in its corner – is quietly fighting its way to the head of the pack.
 [4]
[4]
In normal circumstances we'd expect to see more definitive action ultimately driven by each sector's underlying fundamentals. We're not working with normal circumstances right now though, and there's no indication we'll turn to normal again soon enough to commit to one sector or trade.
Nevertheless, it pays to know where we are, where we came from, and where we appear to be going on a sector-by-sector basis even if the trends don't make perfect sense.
We'll update all these tables and charts as needed.