On the surface it looks stellar. While Friday's mixed bag translates into a zero-sum session overall, few traders couldn't forgive the market for taking a breather. Stocks rallied firmly the first four days of the week, and the S&P 500 is now up 6.3% since its early October low. A pause could be expected here, and is hardly a red flag in and of itself.
There is a red flag waving here, though. Participation in this rally is scant, and waning.
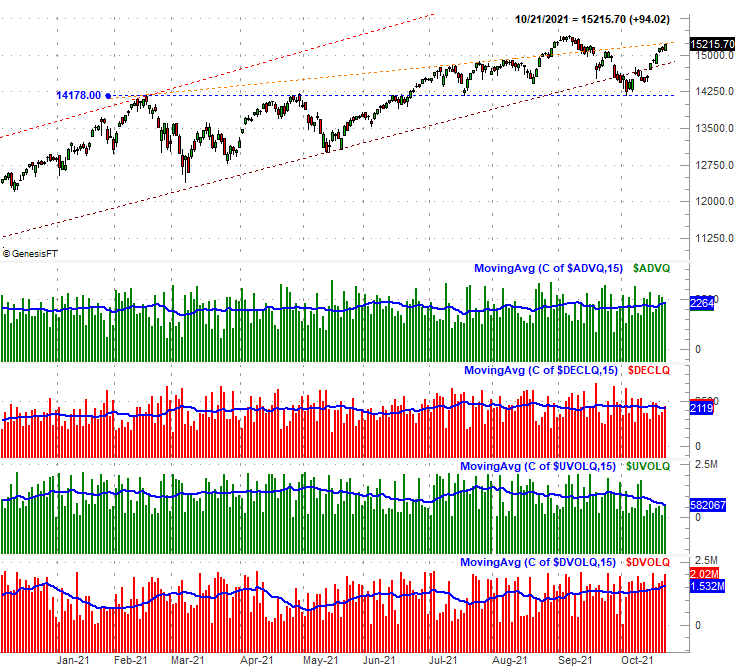
That's not an arbitrary, gut-feeling kind of statement. It's based on data. Namely, the NASDAQ's daily "down" volume is growing, and now accelerating. Conversely, the daily "up" volume for the NASDAQ's listings is shrinking… a trend that's also accelerating. Both data sets and their respective trend (look for the blue line) are clear on the bottom of the chart below. The NASDAQ's bullish and bearish daily volume bars are tickered as $UVOLQ and $DVOLQ, respectively.
 [1]
[1]
It's difficult not to notice that the NASDAQ's daily advancers and decliners are still leaning bullishly. That is to say, the exchange's listings daily gainers ($ADVQ) are on the rise — albeit modestly — while its daily losers ($DECLQ) are drifting a bit lower. That's the deceptive part of the dynamic. The NASDAQ Composite's value looks healthy, in that it's still growing. There's not actually a lot of buying going on here though. It's just that enough of the right names aren't running into a serious selling headwind… at least not yet.
Yes, generally speaking, an exchange's daily advancers and daily "up" volume move in tandem, while an exchange's daily decliners and "down" volume should also be trending in the same direction. That's clearly not happening right now for the NASDAQ.
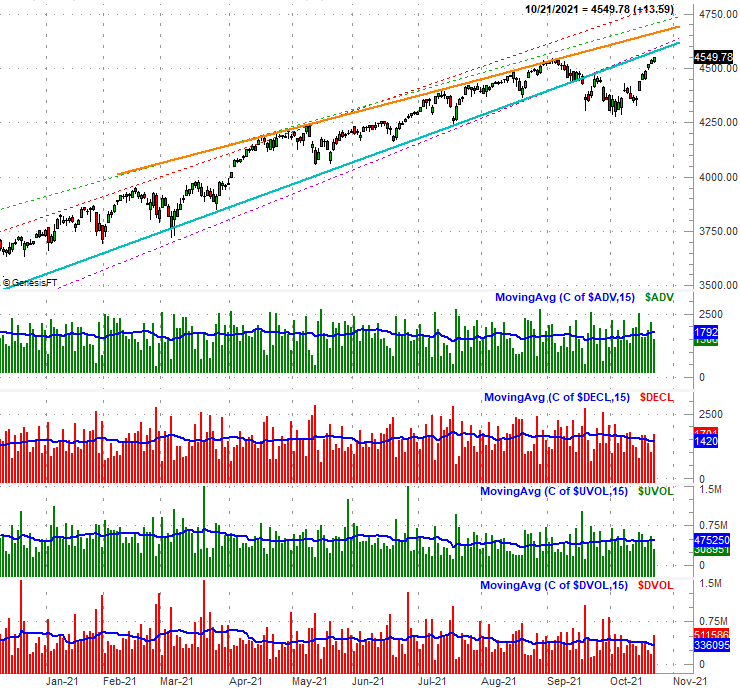
Curiously, the NYSE's listings aren't showing us quite the same trend. As you might expect, the NYSE's advancers ($ADV) are generally on the rise, and have been since early this month in conjunction with the S&P 500's advance. And, while not overwhelmingly so, the NYSE's daily bullish volume ($UVOL) is stable. The exchange's daily decliners ($DECL) are falling as one would expect when the market is rising, while the NYSE's daily down volume ($DVOL) is more or less drifting lower. This is "as it should be" given how stocks as a whole continue to rally.
 [2]
[2]
Just so there's no confusion, yes, the underlying message of these charts' bullish and bearish volume trends are conflicted. The NASDAQ's undertow is bearish, while the NYSE's undertow is still mostly-bullish. That's why there's no firm call to be made here. The goal is to simply point out something that's so unusual about the current situation — something that could be subtly signaling a major problem — that it must be put on your radar. It's noteworthy since the NASDAQ tends to lead the overall market, both higher and lower.
It's not entirely surprising to see this hesitation take shape right as most stocks are dancing with peak all-time highs hit in early September.
As is always the case, we'll update this chart and analysis if and when it's merited.