
The U.S. dollar may be up today, but one day doesn't make or break a trend. Indeed, when one takes a step back and looks at the bigger picture, it's now difficult to argue the greenback is in anything but a downtrend.
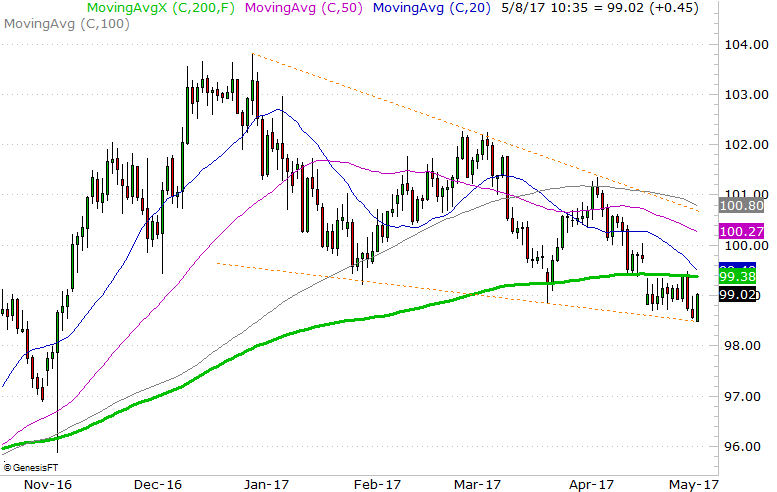
The daily chart of the U.S. Dollar Index below tells the tale. On Friday, the index followed through on a huge bearish reversal put into motion on Thursday, and Thursday's reversal was largely the result of a bump into the resistance at the 200-day moving average line (green). That's been a key line in the sand in the past — support and resistance — and to see the bears take such a decisive stand there is noteworthy.
 [1]
[1]
It's not just resistance at the 200-day moving average line that suggests there's more downside ahead for the dollar though. It's the fact that we've already seen a string of lower lows and lowers highs since the last few days of last year. The end result is a descending wedge pattern, framed in orange. Monday's bounce is being at least partially fueled by the encounter with the lower edge of that wedge shape. But, the 200-day line as well as the 20-day moving average line (blue) both loom above, ready to halt any advance around the 99.40 mark.
There's even more of a headwind than that potential ceiling, however. Another close look at the U.S. Dollar Index chart indicates that all four key moving average lines are now sloped in a downward direction. This is a clear sign that the momentum is bearish in long-term, short-term, and intermediate-term timeframes. It's going to be tough to quell that multi-pronged bearish momentum.
If the lower edge of the wedge pattern breaks down (and odds are good that it will) and lets the index tumble, things could get real ugly, real fast.
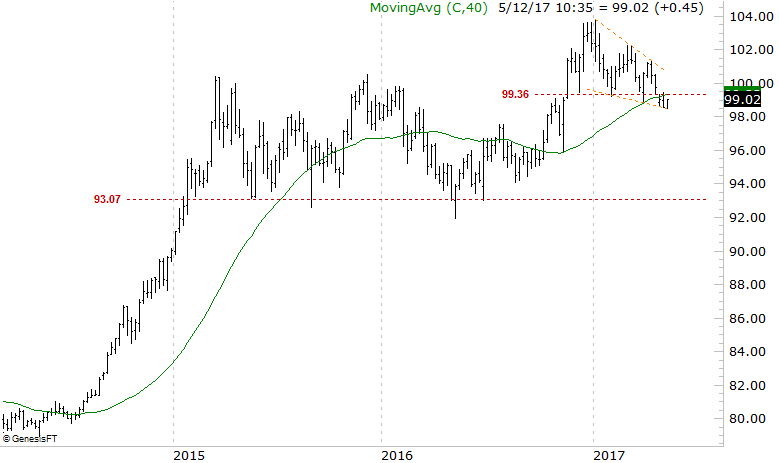
To fully appreciate just how overextended the U.S. dollar got by the end of 2016, one has to zoom out to a weekly version of the chart. It's from this point of view we can see the U.S. Dollar Index soared in 2014 and 2015, and rather than cooling off as it arguably should have, it heated up again beginning in October.
 [2]
[2]
The weekly chart also paints a picture of where the U.S. dollar could pull back to before the bulls step up to the plate again. The big floor here for the U.S. Dollar Index is around 93.0. And if that support line breaks, it's a game-changer for all facets of the market.
A major meltdown of the greenback isn't apt to be in the cards though, particularly with interest rates poised to keep rising. Indeed, the dollar's rise was largely predicated on a series of rate hikes that were, in retrospect, not very realistic. The Fed is putting in interest rate increases at a much slower pace than most anyone initially expected. It's possible for the greenback to keep falling even if rates continue to edge higher…. even though that's not the historical norm. [The 2014/2015 rally from the dollar panned out despite a complete lack of rising rates, so there’s clearly a disconnect here.]
It's not a bad thing, mind you. In fact, a falling dollar would likely do U.S. companies far more good than harm. Not only would it make American-made goods and services more affordable to foreign buyers, it would make Made-in-the-US goods and services relatively more attractive to U.S. consumers and companies, fueling a little extra home-grown economic activity.
The added bonus is that the weaker the dollar, the stronger the price of oil. Though that means higher gasoline prices, it would prove to be an outright boon for oil companies that have been struggling to turn a profit since 2014… when oil prices tanked thanks to a rising U.S. dollar.
Whatever the impact, the U.S. dollar is peeling back, and close to moving from bad to worse.