
With just a quick glance it would be easy to chalk up Monday's action to a temporary stumble. After all, the S&P 500's setback was modest, and the Dow actually logged a small gain. The only big loser was the NASDAQ, and that's most likely because its biggest have been overextended for a while. We knew they had to get reeled in sometime. We've survived worse.
There's more nuance buried in Monday's action than it may seem on the surface though… a lot more. The fact it, what happened on Monday is just as extension of what's been happening (albeit erratically) for several days now, pointing to a bigger turning of the tide.
But, first things first.
We noted in Monday's Weekly Market Outlook [1] – which examines the indices technical condition through last Friday – that the S&P 500 was starting to attack the support line (plotted in orange) that's been guiding the market higher since last March. The index briefly traded below that floor late last week but bounced back above it before Friday's closing bell rang. But, with Monday's modest selloff, the S&P 500 is not only below that floor again, but also back below its 50-day moving average line (purple). Perhaps more noteworthy of all is that all it took was a kiss of the 20-day moving average line (blue) with Monday's high to get that reversal started.
 [2]
[2]
The NASDAQ Composite looks relatively similar to the S&P 500, with one key difference…. the composite already broke under its long-term support line (orange) last week, and logged a close below its 100-day moving average line (gray) on Monday.
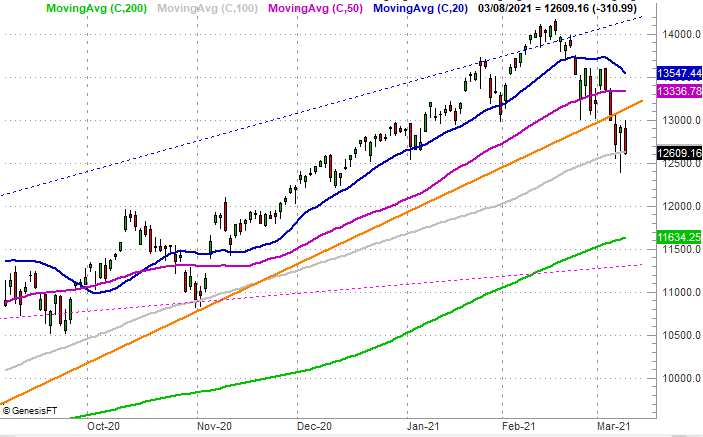 [3]
[3]
This matters, and for more of a reason than you might think.
Yes, the NASDAQ's biggest and most influential names – the FANG stocks in particular – were due for a correction. Problem is, now that they've got some bearish momentum going they're going to be tough to stop, or even slow down, now that some of them are below now just their 100-day lines, but their 200-day moving average lines as well. Facebook, Amazon, and Netflix are all now under this major long-term average line, suggesting their weakness is well-developed.
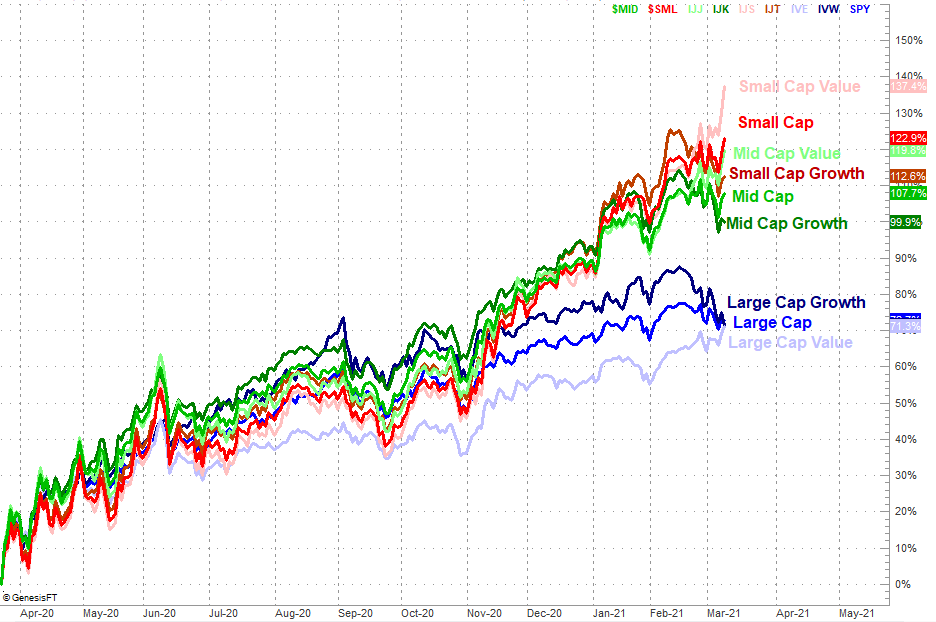
Were it just this, the selloff might be something to dismiss. It's not just this, however. We're seeing a curious rotation out of aggressive growth names like Netflix and Facebook, and into value and safe blue chips.
Yes, the Dow's gain on Monday is a subtle hint of this, although not the only one. The quest for value is on in a big way regardless of market caps. Small cap, mid cap, and even the lagging large cap value groups are accelerating higher, while growth is struggling. Large cap growth stocks are getting downright hammered… the large cap growth names like the NASDAQ's biggest listings.
 [4]
[4]
The strength in value and small caps is deceptive, however. If this is all a sign of a much bigger correction, value and small caps and blue chips won't thrive at the expense of large cap growth. All of these names will eventually roll over and lose ground. Said another way, it only pays to pick market caps, styles, and sectors if the whole tide is rising. If the tide's going out, it's going to take everything with it.
We're not there yet despite the NASDAQ's 10% selloff from its recent peak. That's a full-blown correction, but also a setup for a big bounce. It's the reaction to any rebound effort you'll want to watch closely. If it peters out and the indices fall back below their 100-day or 200-day moving average lines, that may be enough to get traders to throw in the towel and spark a pullback that's now overdue. If the bulls regroup nicely here and start well-paced (read "sustainable") recovery move, then take that move at face value.
Stay tuned. This is all coming to a head pretty soon. Traders are going to have to make major commitments.