
 [1]If you're reading this, then you're likely already stoked about what the rest of the year is supposed to look like. The S&P 500 was up through the first five trading days of the year. Ergo, it should log a gain for the entirety of 2023. That's the crux of the so-called "first five days" theory.
Before plowing into the market just because one axiom is telling you to, however, you might want to take a step back and rethink the idea with a little data in mind… and in hand.
But, first things first. What's this theory all about? It really is as simple as described. The premise is, if stocks make gains over the course of the first five trading days of any year (this year, the S&P 500 was up 1.4% through Monday's close), it means traders are thinking bullishly for the long haul after being given a "clean slate" that is the new calendar year. The math even seemingly says the odds of a full-year gain are high … about 80%, using data going back several decades.
Except, the theory and the math allegedly supporting it has a gaping flaw. That is, the market logs gains for about three-fourths of all years anyway. The slight edge it seems to have when the first five days are bullish could be considered statistically insignificant, or mere chance. It's not exactly enough of an edge to make a major bet on.
This reality check, however, is made more real when checking the inverse of the theory: Does a losing first five days have a clear tendency to lead off losing years, proving that the 80% success rate as a bullish indicator means something?
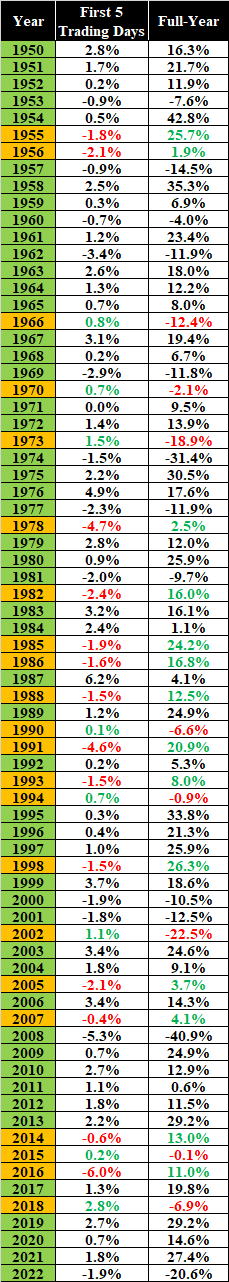
In short, not really. Going back to 1950, the 26 times the S&P 500 suffered a loss for the first five days of the new year, it still made a gain in a little more than half of them.
That's still seeming success, and to be fair, there's possibly something to theory. There's not enough to the idea, though, to make this particular idea one worthy blindly following.
See, you could pick any random five-day stretch of the year, apply the same idea, and get the same basic outcome. A five-day winning streak in mid-February has an 80% chance of coinciding with a twelve-month gain. A five-day losing streak in April has a 46% chance (give or take) of kicking off a twelve-month loss. The first five trading days of a new year are usually just part of a much bigger bear or bull market.
And perhaps worse, when the first five days theory is wrong, it can be really, really wrong. Take 2002 as an example. For a brief while it looked like the bear market started in 2000 was finally coming to a close, with the S&P 500 gaining 1.1% in just the first few days of that year. By the end of 2002 It had lost more than 22% of its value. Conversely, a bunch of investors were discouraged by the lousy start to 1991, when the index lost 4.6% for its first five trading days of the year. By the end of 1991 the S&P 500 was up nearly 21%.
So, take note of the message the theory is delivering early in the year. Just bear in mind it's only a theory, and not an ironclad guarantee. There are a bunch of other factors to consider when making trading plans, not the least of which is the ever-changing shape of the market's charts, and the economic backdrop pushing them higher or lower.