Strategist sees stock market at ‘tipping point’
By Sue Chang, [1]MarketWatch
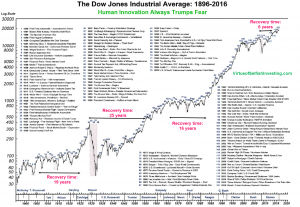
The Dow Jones Industrial Average is one of the oldest and best-known indexes in the world. It has, by its nature as a benchmark for the largest stock market in the world, become an important barometer of global confidence over the years.
 [2]
[2]
Chris Kacher, managing director of MoKa Investors, this week published a graph of the Dow’s performance since 1896 that charts how the index’s peaks and troughs have reflected the U.S. economy’s triumphs and tribulations. But more than that, the graph also illustrates how the Dow has become a chronicler of investors’ responses to significant global events.
At its simplest, the chart proves once again that over the long term, the stock market always rises because “intelligence, creativity, and innovation always trump fear,” according to Kacher.
Yet at the same time, it also underscores the basic mantra that market participants need to stay nimble during times of uncertainty to maximize their returns.
Investors must stay fluid to changing market conditions and not become wedded to their stocks, said the strategist.
“There is no get-rich-quick scheme. There is no such thing as a black box where you press a button and let it run indefinitely. Investing is more challenging than brain surgery,” Kacher told MarketWatch.
The Dow (DJIA) which began its career with 12 components, has risen more than 50,000% over its lifetime. During the same period, the U.S.’s nominal gross domestic product has boomed 118,583%, according to Measuring Worth, a website run by academics Lawrence Officer and Samuel Williamson.
But the Dow’s upside trajectory has always not been smooth. In between its bursts of energy that eventually took the blue-chip index to the 20,000 mark in 2017 were long periods of misery when the market remained in a downward spiral or moved sideways.
As the chart shows, it took 25 years for the market to recover from the 1929 stock-market crash, and 16 years for stocks to bounce back from the combined effect of the Vietnam War, the 1973 oil shock and the resignation of President Richard Nixon.
For Kacher, the current market is a prime case where investors need to distance themselves from their emotions and remain fleet on their feet.
After having gone 109 sessions without a 1% drop, the Dow fell 1.1% on Tuesday as President Donald Trump’s ambitious agenda ran up against the reality of politics.
Trump is struggling to secure enough support to pass the American Health Care Act. His failure or success with the health-care bill is being closely followed by investors, who see it as a critical test of his ability to press ahead with other key policies including tax reforms and infrastructure spending.
The market is very vulnerable from a technical point, given the selloff of large-cap stocks earlier this week, said Kacher. But that by no means suggests that a correction is inevitable given that the positive impact of the Federal Reserve’s quantitative easing program still lingers
“We are at a minor tipping point and we are not sure where the market is headed,” he said.
As a result, investors must be prepared to adjust their strategies to adapt to the changing environment.
“Be flexible,” he said.
As his 120-year chart clearly demonstrates, the market always recovers. But sometimes, it just takes a little longer.
Courtesy of MarketWatch [3]