
Here we go again. Just when the market teases traders with the prospect of a much-needed correction, the bulls step up to the plate again to sidestep such a move. Like all the rest of the recovery efforts, this one isn't apt to go anywhere. On the other hand, as long as the bulls are enforcing their line in the sand, stocks are going to slump either.
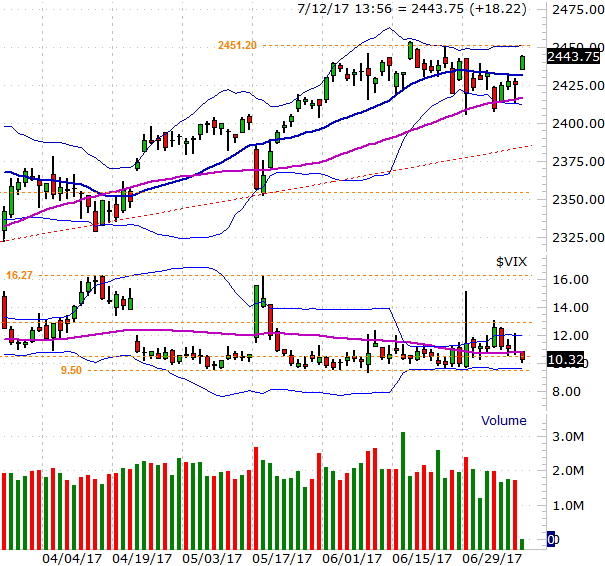
The daily chart of the S&P 500 below tells the tale plainly enough. During the latter half of June and first days of July, the index slide lower… right until it bumped into the 50-day moving average line (purple). It danced there for a few days, but finally used that line as a springboard today.
 [1]
[1]
That's a bullish sign, but it's anything but an ideal bounce. Though the S&P 500 has moved back above the 20-day moving average line, it did so by leaving a gap behind. The market generally doesn't like to leave gaps unfilled, meaning there's likely to be some downward pressure from here. The index may need to test the 2451 area first before staging a setback. That's where the index peaked last month, and where the upper 20-day Bollinger band is now, both of which are very plausible technical resistance. Or, we may not see that happen.
Also of concern is the fact that the VIX is getting back near an absolute floor at 9.5. In fact, the room between where the VIX is now and 9.5 is more or less the room the S&P 500 needs to rise before bumping into the 2451 ceiling. That is to say the floor and the ceiling are apt to be bumped into at the same time, making a reversal more likely at that pivotal level.
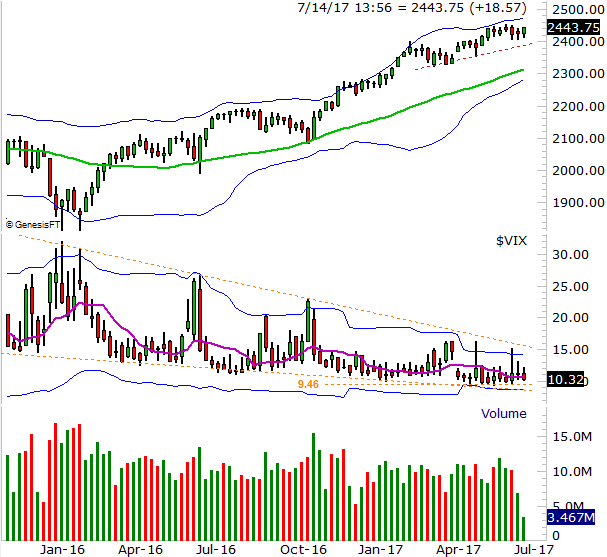
It's not until you zoom out to a weekly chart of the S&P 500, however, you can really appreciate why so many traders are hesitant to step into the uptrend — it's gone on too long without a major correction. The last time we saw a major, cleansing setback was in January of 2016. The biggest high-to-low move we've seen in the meantime is the 5% drawdown in the fall of last year. Trading veterans know that's uncomfortably unusual.
 [2]
[2]
It's also on the weekly chart we can see the VIX may have already found, or made, an absolute floor. If there's no room for the VIX to move meaningfully lower, there may not be room for stocks to move meaningfully higher either.
It's a conundrum to be sure. Stocks have disconnected from value-oriented prices and are now trading on sentiment and/or assumptions. That's fine… whatever works. But, there will come a time when traders decide earnings matter. And at current levels, most stocks can't justify their current valuations. It's just that nobody wants to get out of the uptrend while there's still some bullish momentum to tap into.
The make-or-break line in the sand is (still) the rising support line for the S&P 500 on its weekly chart. It's presently at 2385, and rising. If that line snaps as a floor, that could mark the point where traders finally decide there's more risk than reward in stocks. If the VIX happens to move above the upper edge of its converging wedge pattern — framed by orange lines — that will underscore the odds that a sizeable selloff could be underway.
Those are all big "ifs," of course, and the charts have fooled investors before.
Bottom line? The trend is your friend, but this particular trend isn't one you can afford to take your eyes off of for a single day.
For more perspective on trading these markets, check out Price's video looks [3].