Weekly Market Outlook - While the Bears are Away, the Bulls Will Play
Another week, another win. Against the odds, the market followed-through on the reversal effort that started with the reversal move from two weeks ago. Last week's 1.6% gain from the S&P 500 left it at the highest weekly close since early March. It doesn't 'feel' right, but what the market is doing is so much more meaningful than what one thinks it should be doing.
 Still, the market's advance seems more like a matter of the bears just not putting up a fight, biding their time, than it feels like the bulls taking things (no pun intended here) by the horns.
It doesn't really matter. A rally is a rally regardless of the reason. But, the two-week stretch for the S&P 500 is one of the biggest and best spans we've seen in a while, yet it's not entirely clear stocks are worth more than they were just a few weeks ago.
We'll slice and dice it all below, after a run-down of last week's and this week's economic announcements.
Economic Data
Pretty light week last week. In fact, there were only two items of real interest - the ISM Services Index (to round out the prior week's ISM Manufacturing Index) and the previous week's crude inventory levels report.
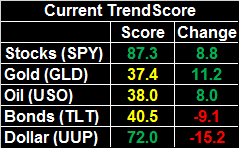
The ISM numbers look good. Services rolled in better than expected, at 58.6. Manufacturing was up too. Most important, both remain above the critical 50 level, and better still, both remain in broad uptrends.
ISM Index Charts
Source: Thomson Reuters
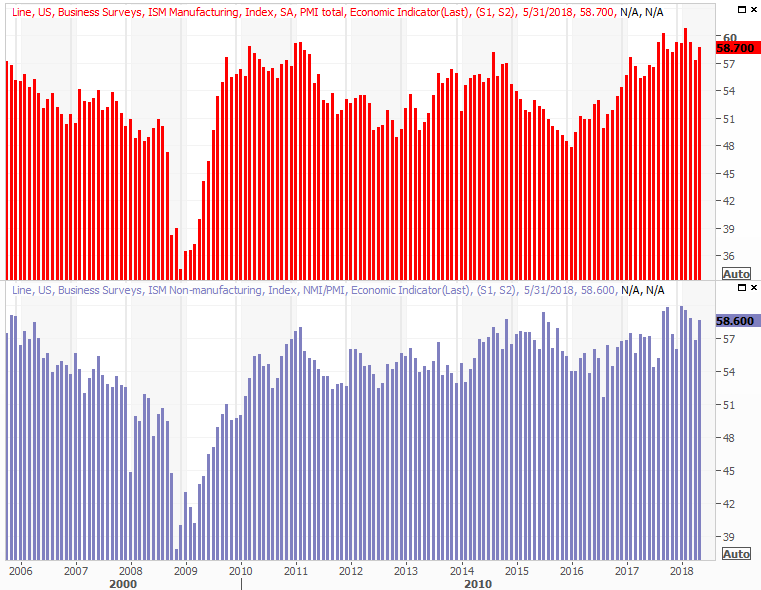
As for stockpiled crude oil, it's been on the rise - working against oil prices - and that didn't change last week. Stored-oil levels ramped up to 436.6 million barrels. The uptrend is slowing, which shows some level of discipline from drillers and explorers. That said, a little more slowdown would be even better for the oil industry's long-term bottom line.
Crude Oil, Natural Gas Inventory Charts
Source: Thomson Reuters
Everything else is on the grid.
Economic Calendar
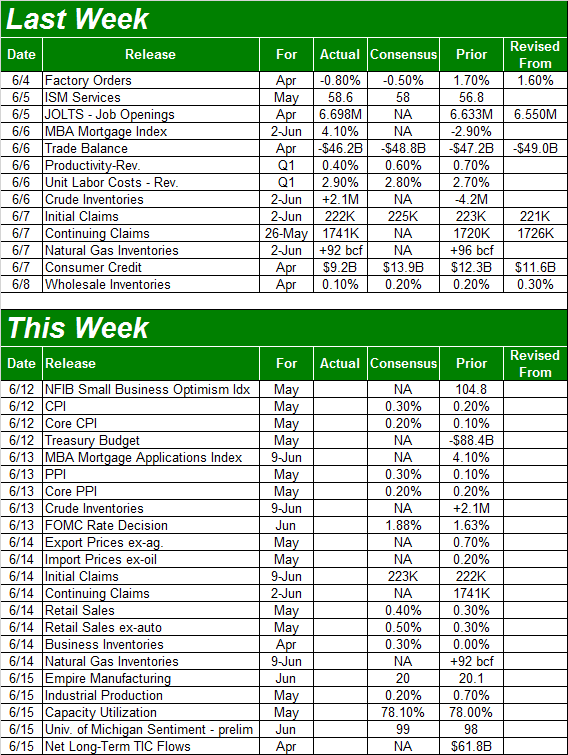
Source: Briefing.com
Buckle up. It's going to be a wild week.
The highlight, of course, will be Wednesday's interest rate decision; a quarter-point rate hike is all but guaranteed. As is always the case though, the Federal Reserve's accompanying rhetoric is what could really make or break the market.
First things first though. The party starts on Tuesday with last month's consumer inflation report, and on Wednesday's morning we'll hear about May's producer inflation. Economists are looking for firmer price increases than we saw in April, and as you can see, it's heating up in all stratifications. The Fed doesn't have a lot of choices here.
Annualized Inflation Charts
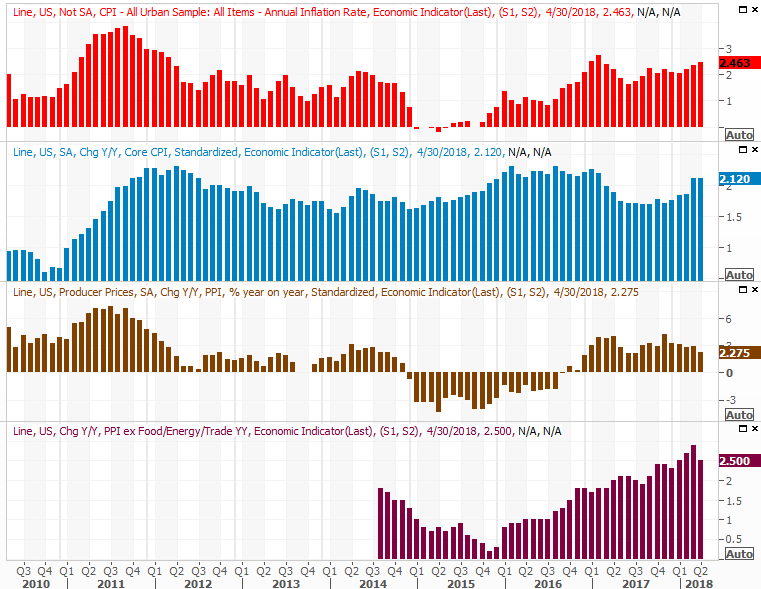
Source: Thomson Reuters
The overall annualized inflation rate now stands at 2.46%, but is rising consistently enough to say one or even two rate hikes isn't going to quell it... especially knowing the economy is roaring.
On Thursday we'll hear about last month's retail sales. Economists suspect spending not only remains firm, but accelerated slightly from April's levels. It's impressive, really, how spending growth is not only holding steady, but seemingly accelerating.
Retail Sales Charts
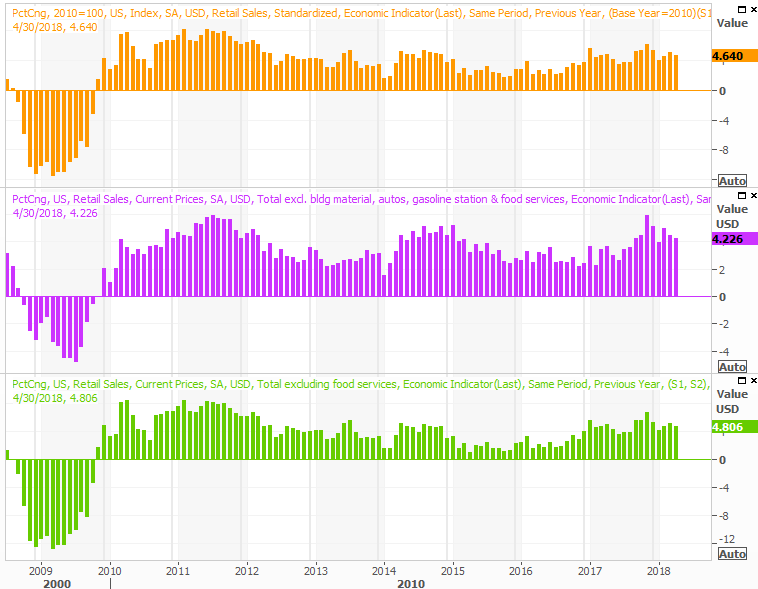
Source: Thomson Reuters
Also on Thursday keep your ears open for last month's industrial productivity and capacity utilization numbers... arguably the second-most important report for the coming week (and the one we have the lease clue about). The pros are calling for a little more growth, but just barely. The trajectory is still encouraging though.
Industrial Productivity and Capacity Utilization Charts
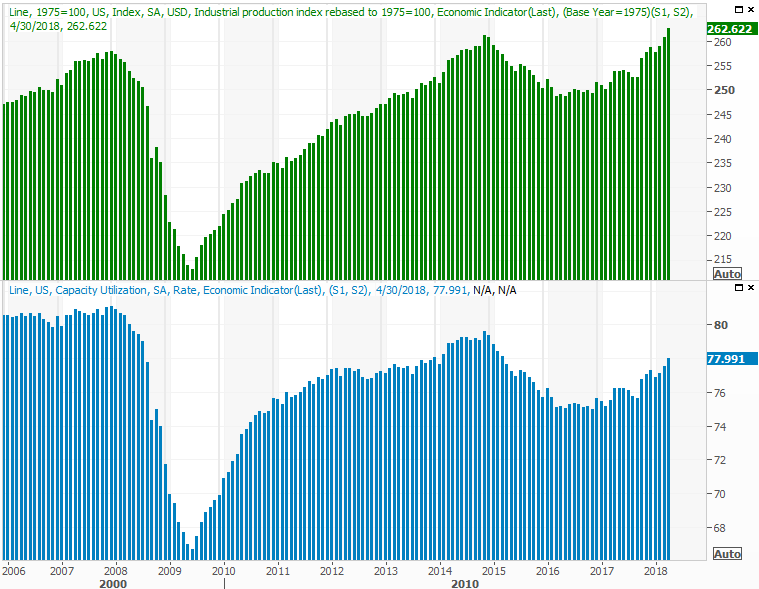
Source: Thomson Reuters
The productivity and utilization are closely related to corporate earnings, and therefore good long-term market indicators. Their current rise is good for the market, though that can't stave off any short-term correction.
Index Analysis
The bulls just can't be stopped. Despite a couple of opportunities to quell the rally before it got going in earnest last week, the bears didn't take their shot.
That might just be an indication of disinterest from would-be bears. Friday's gain was impressive, but on minimal volume. Indeed, though the volume since the late-May reversal has been respectable, it's not exactly been unusually strong.
Still, for the first time in a long time, an encounter with the upper Bollinger band didn't lead to an immediate pullback.
S&P 500 Daily Chart, with VIX and Volume
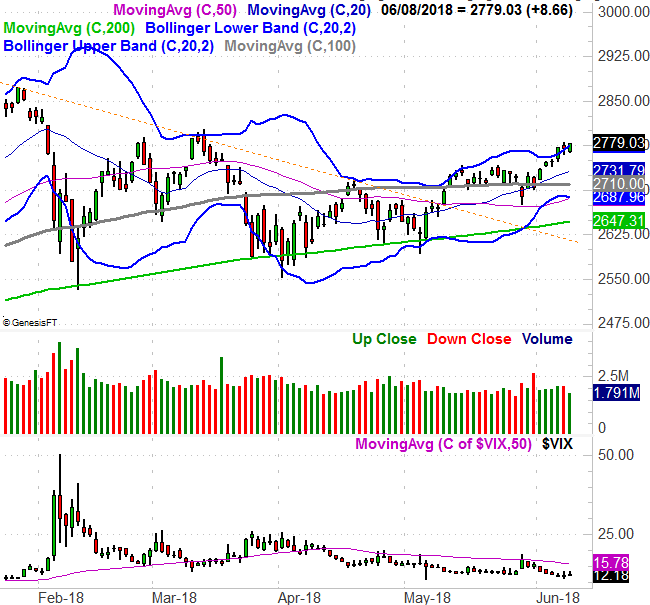
Source: TradeNavigator
Ditto for the NASDAQ Composite. But, the NASDAQ also hit another record high last week, and closed above the prior peak hit in March. It matters, simply because the NASDAQ leads the market... higher and lower. If it's charging ahead, the rest of the market should follow that lead.
NASDAQ Daily Chart, with VXN and Volume
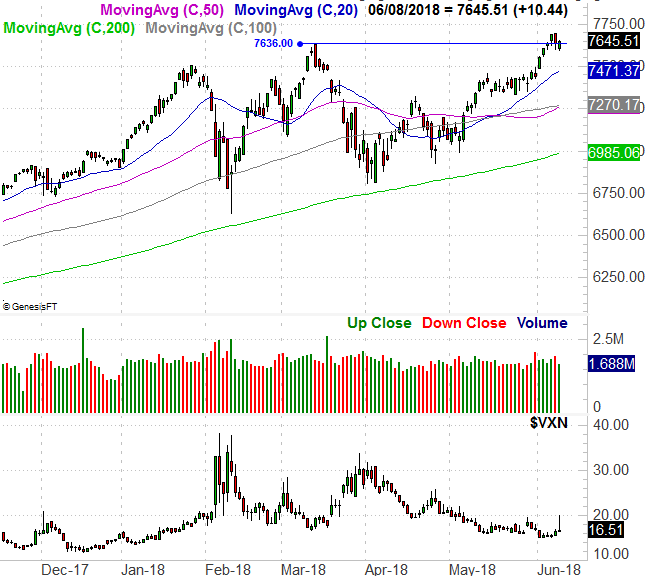
Source: TradeNavigator
So what's the call? Take a look at the weekly chart of the S&P 500. The index blasted above the previous weekly peak around 2745, and did so after forming a pretty well-grounded reversal effort. The 200-day moving average line (green) was a major floor - as it should be - and the consolidation we saw between February and April coiled the spring that's uncoiling in a bullish direction now.
S&P 500 Weekly Chart, with VIX and Volume
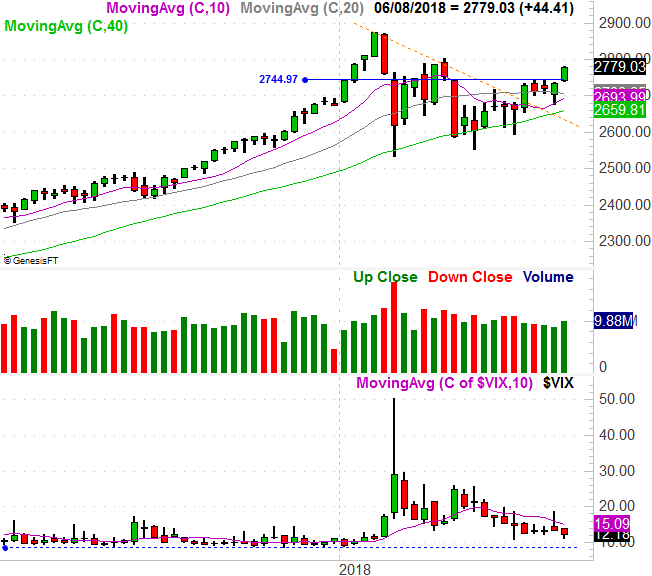
Source: TradeNavigator
It's not a perfect rally though. Were in the midst of a time of year when stocks aren't "supposed to be" bullish. That's not to say they can't or won't log a bullish June this year. But, it's statistically unusually, and there are lots of things to worry investors into sending stocks lower [North Korea, inflation, political unrest, etc.] There's also not much room left before the VIX bumps into an established floor around 8.6.
That's the long way of saying even if the rally does last a little longer, it may not last a lot longer.
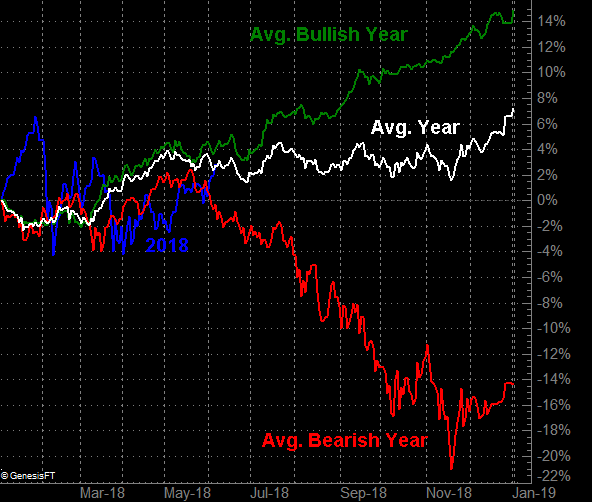
The graphic below puts 2018's performance-to-date in perspective, relative to its average year, and its average bullish and bearish years.
S&P 500 Average Annualized Performance Chart (day-to-day)
Source: TradeNavigator
If this year is going to be a 'good' year, it's not like it's too far ahead of its normal path yet. Either way though, things should start to get real interesting real soon. The bad part of June is usually the latter half of June.