Weekly Market Outlook - There's a Silver Lining Behind This Dark Cloud

The bulls tried their best, pushing stocks into the black for a short while last week following the previous week's crash. When push came to shove though, it was the bears doing most of the shoving. The market ended last week on a bearish foot, and below some key lines in the sand.
Except, there's one small glimmer of hope following last week's action, and perhaps something to look forward to... in a sense.
We'll explain it all below, as always. First, however, let's review last week's biggest economic announcements and preview what's coming this week. Spoiler alert: We're going to get last month's jobs report on Friday, and it could be market-moving.
Economic Data Analysis
We completed the most recent snapshot of the real estate market last week. And, it's ugly. For the first time since 2011 (not counting the COVID-related slowdown in mid-2020) the average home price fell from the prior month's levels. The FHFA Housing Price Index tumbled by 0.6% in July from June's levels, and the Case-Shiller Index fell by a comparable amount. In fact, the Case-Shiller's slowdown was the biggest in years.
Home Price Charts
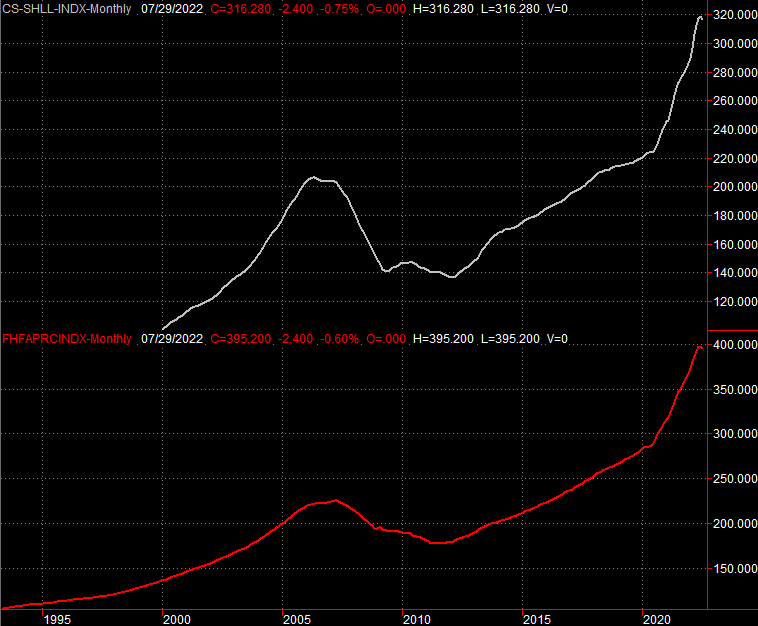
Source: FHFA, Standard & Poor's, TradeStation
One poor month isn't the end of the world. But, all big trends start out as small ones. There's no particular reason to think this couldn't be a sign of the shape of things to come.
August's new home sales offer a glimmer of hope... on the surface. The annualized pace jumped from 532,000 to 685,000, trouncing estimates for sales of 500,000. There's an important footnote to consider here, however. That is, a bunch of people may have been rushing to buy a home before interest rates shot higher. Either way, that figure isn't an especially strong figure, in light of recent history. Also bear in mind that August's sales of existing homes were particularly poor.
New, Existing Home Sales Charts
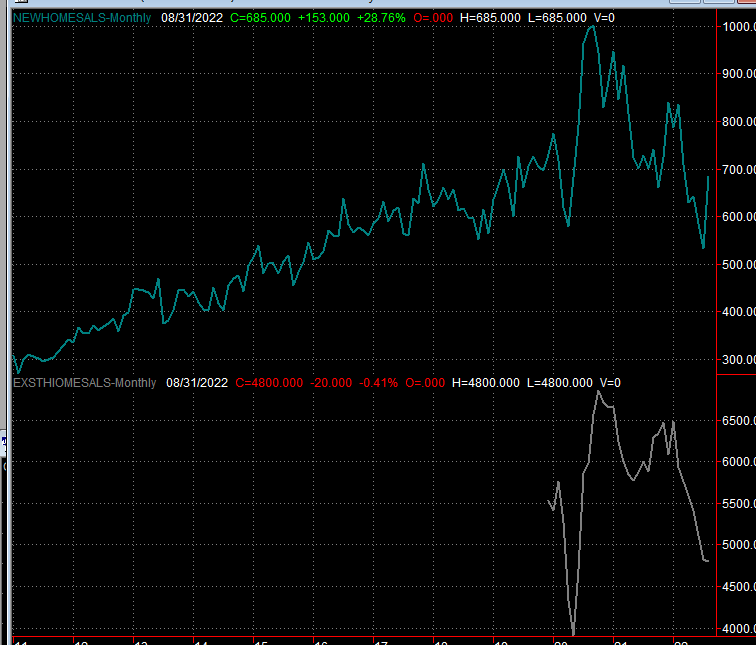
Source: Census Bureau, National Assoc. of Realtors, TradeStation
Also note that pending home sales fell 2% in August, confirming real estate is running into a headwind.
It wasn't all about real estate though. It was also a big week for sentiment measures, which all in all were pretty good... at least compared to August's reading. The Conference Board's consumer confidence level inched up from 103.6 to 108.0, while the University of Michigan Sentiment Index came on a 58.6 for last month, up a bit from August's 58.2. Both are better, but only better than the lows seen in the midst of the pandemic. Overall, it's still pretty weak.
Consumer Sentiment Charts
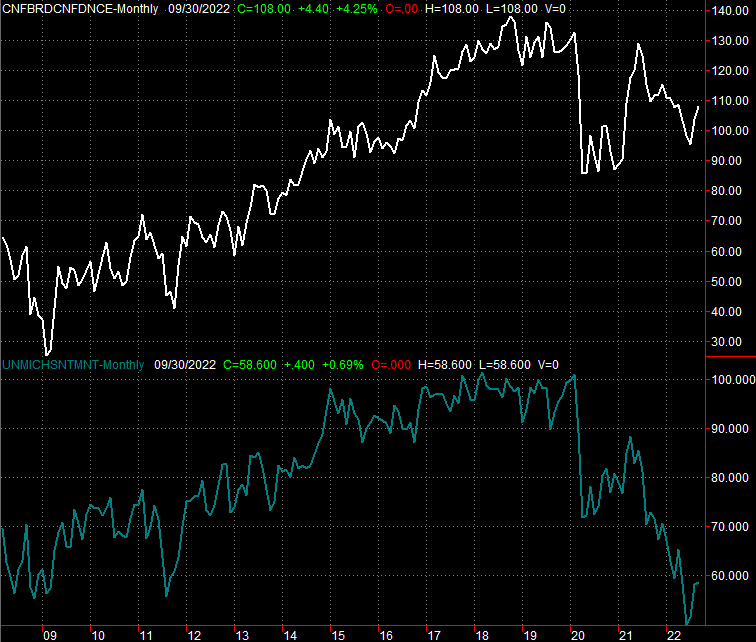
Source: Conference Board, University of Michigan, TradeStation
Everything else is on the grid.
Economic Calendar
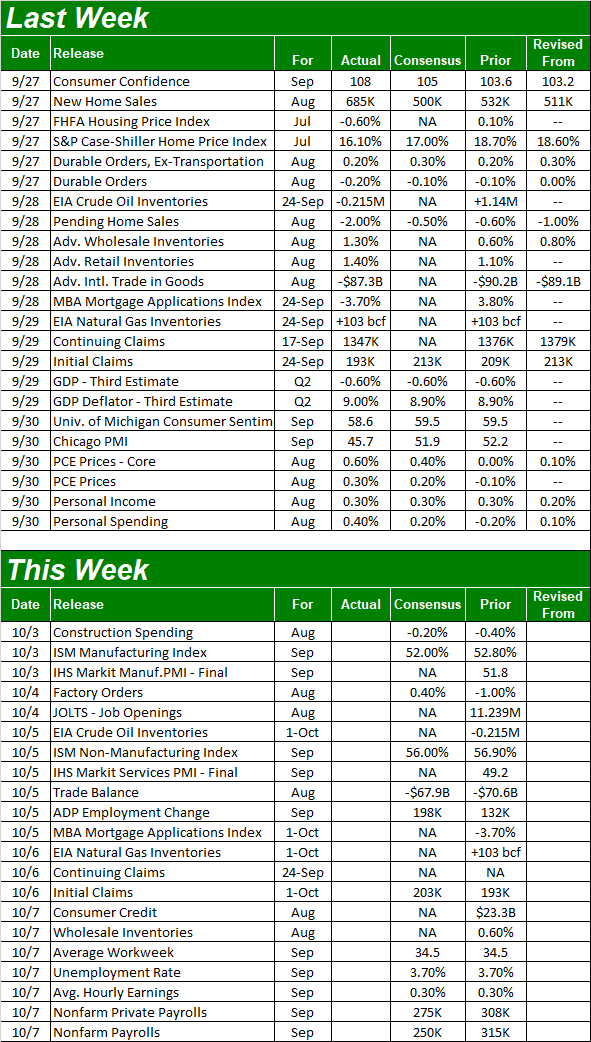
Source: Briefing.com
This week doesn't have much going on, but there are couple of doozies in the lineup.
One of them is the ISM's look at last month's services and manufacturing activity. The manufacturing measure will be posted on Monday, and should be down slightly from August's reading. Wednesday's look at the services arena should also be down a bit. Both figures are still above the key 50 level, although notice that both have also been trending lower for some time.
ISM Services and Manufacturing Index Charts
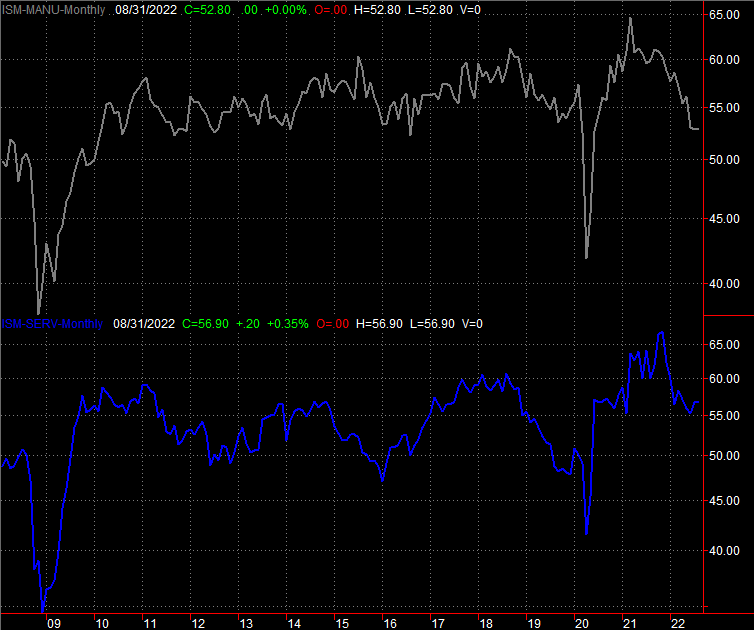
Source: Institute of Supply Management, TradeStation
Finally, look for September's jobs report on Friday. Payroll growth should slow to 250,000, from 315,000 in August. That won't be enough to change the unemployment rate from 3.7%. If for some reason this report comes up short of expectations though, that could easily up-end an already-fragile market.
Payroll Growth and Unemployment Rate Charts
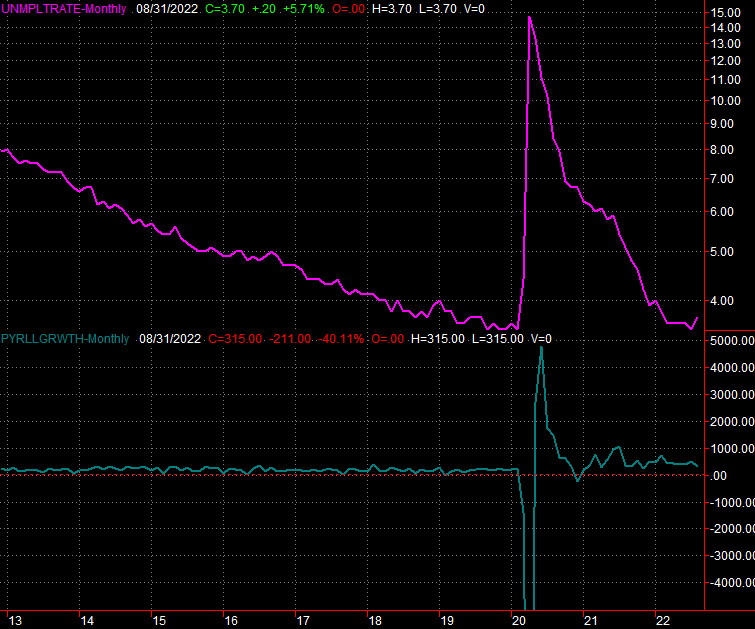
Source: Bureau of Labor Statistics, TradeStation
Stock Market Index Analysis
There's no two ways about it -- last week was (another) disaster. The S&P 500's 3% tumble over the course of the five-day stretch drags it to 13% below its peak from just three weeks ago, and 17% under its August high. Perhaps worse, the move pulled the S&P 50 under its floor at 3637. Now that it's under this support level, it gets much easier to make lower lows... since there's no natural floor to land on. The weekly chart puts it all in perspective.
S&P 500 Weekly Chart, with VIX and Volume
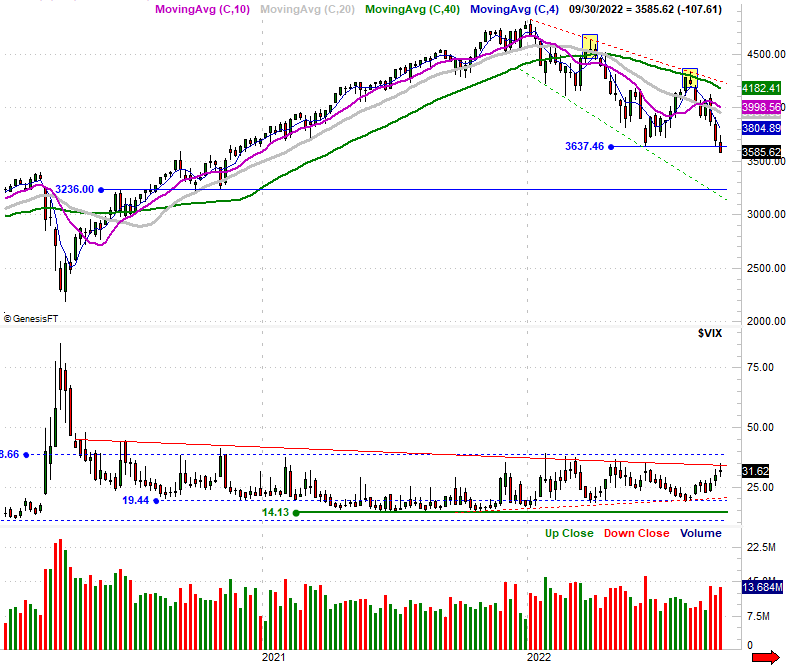
Source: TradeNavigator
The weekly chart of the S&P 500 also shows us something else that's kind of curious though. That is, the S&P 500's Volatility Index (VIX) seems to have bumped into a key technical ceiling (red) without actually pushing above it. It's possible it may be at its own peak, which would imply a bottom for the market is already in.
As we mentioned a week ago though, it's entirely possible for the VIX to simply drift sideways (or even continue to inch higher) while the market continues to lose ground. Note that there's another equally-important ceiling for the VIX at 39 (blue, dashed) that may need to be tested before the ultimate bottom has been made.
It's just one possibility though. Another possibility -- the bullish possibility -- is presented by the NASDAQ Composite. As its weekly chart indicates, the composite fell all the way back to June's low near 10,650 (blue), but didn't actually move under it. The bulls may have drawn a mental line in the sand there.
NASDAQ Composite Weekly Chart, with VXN
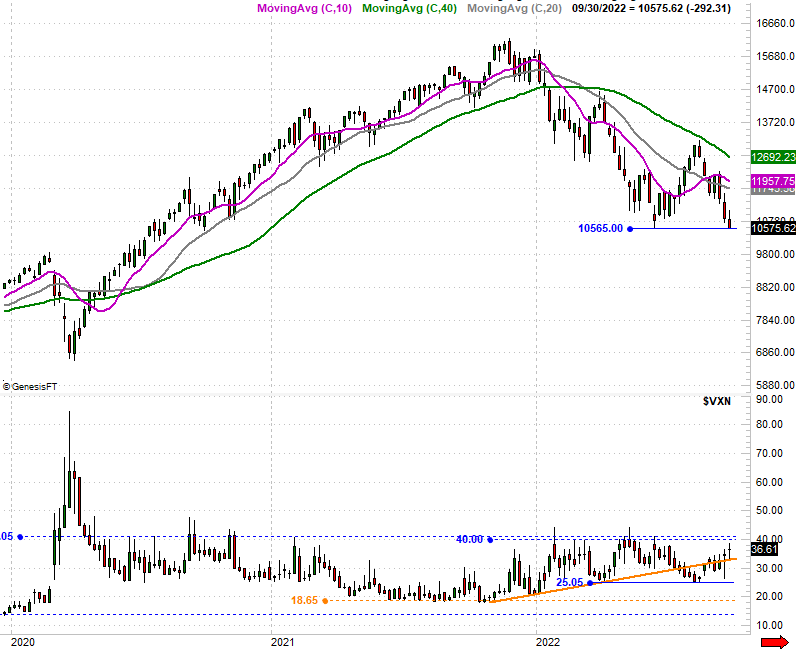
Source: TradeNavigator
Here's the daily chart of the S&P 500, for a little added detail. It also looks at the NYSE's daily bullish and bearish volume as well as its daily advancers and decliners. As you can see, breadth and depth have been leaning bearishly for several days now, and that didn't change -- at all -- as last week wore on. That's a firmly bearish hint as well.
S&P 500 Daily Chart, with NYSE Advancers and Decliners, Up and Down Volume
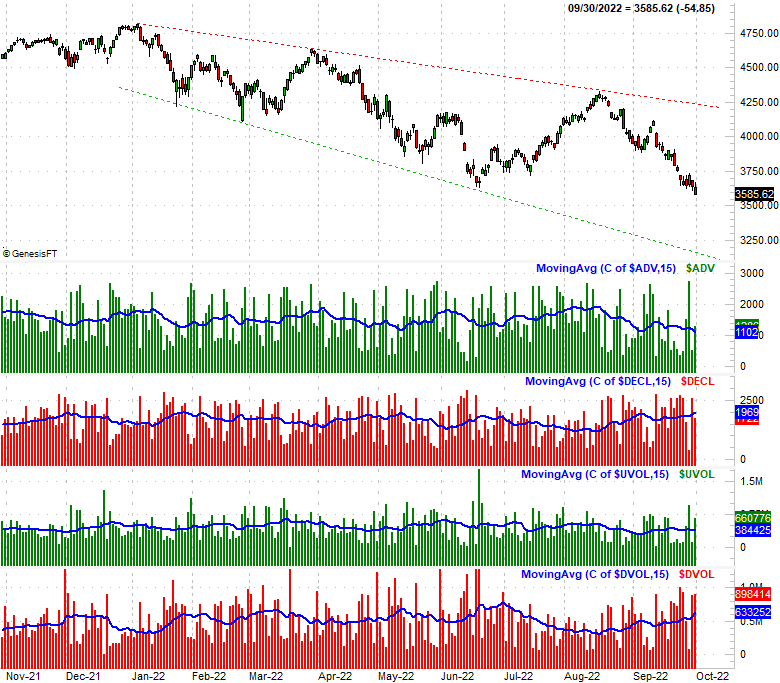
Source: TradeNavigator
There's a prospective upside in all of this, however. While it opens the door to a little more downside, this budding breakdown may well be the last leg of what's turned into a full-blown bear market.
The calendar has a lot to do with it. See, bear markets tend to end in October following a September rout that typically bleeds into early October. The chart below illustrates the idea. While this year is far more bearish than things would normally be at this point, it's clear that under almost all circumstances the pain stops in October even if the month of October is wobbly throughout.
S&P 500 Average Year Performance, Cumulative, Day-by-Day
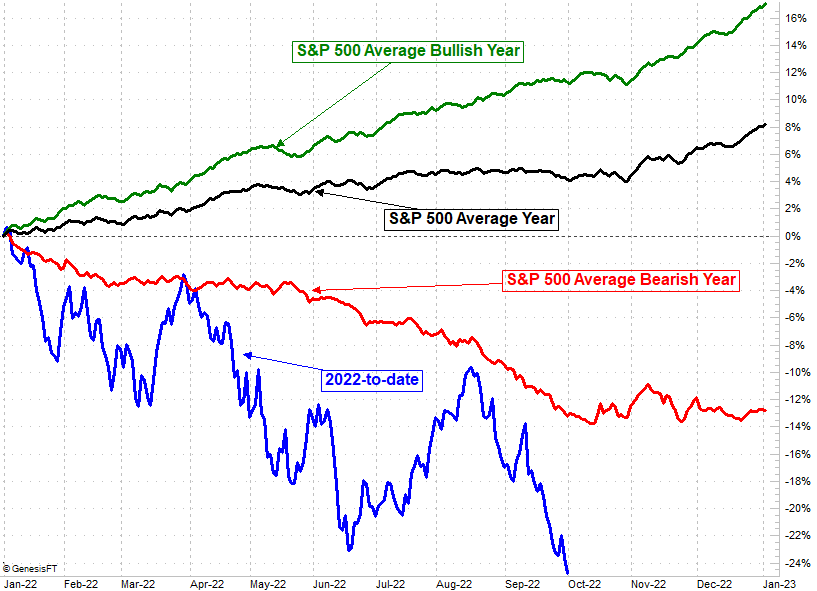
Source: TradeNavigator
Connect the dots here. The next major low could be the major low, leading into more prolonged and permanent bullishness.
That seems a bit tough to believe, given the economic backdrop. Take a step back and look at the bigger picture though. China is finally dovish rather than hawkish, having seen the impact of rather Draconian efforts to curb the coronavirus. The Fed may be rethinking its role in the stock market's rout as well, recognizing it can't impose rate hikes with impunity even if inflation remains rather rampant.
Things may start out on a bullish foot this week. Just don't be too quick to jump to conclusions though. Any bullishness will need to be tested and verified first, ideally by overcoming any selling pressure. Either way, let's stay on the sidelines for a bit to see how this all shakes out.