Weekly Market Outlook - The Slow Rally is Reaching a Tipping Point

What a week! Though stocks ultimately survived and managed to retain a small weekly gain, it was ugly, and tough. The bears wanted to dig in on Friday in response to the rekindled tariff wars, and the Fed was less than dovish with the language that accompanied Wednesday's rate hike. Given the headwind, it would be wise to be even more prepared for all contingencies this week.
We'll show you what's alarming, even if largely overlooked, about the market below. First, however, let's run through last week's economic announcements and preview this week's economic news.
Economic Data
We won't be going 'in order of appearance' this week, but rather, will begin with last week's big Kahuna... the FOMC's unsurprising decision to scoot the Fed Funds Rate up by a quarter of a point; the target rate is now between 1.75% and 2.0%.
But, the Federal Reserve changed up its language slightly. Gone is the suggestion that the federal funds rate was "likely to remain, for some time, below levels that are expected to prevail in the longer run," and newly introduced was an observation of "sustained expansion," in regards to the economy. Put it all together, the Fed sees the need to really put the brakes on things before inflation races out of control. Speaking of...
Yes, we also got a look at that current inflation situation as of last month. Consumer inflation was up, more or less in line with expectations (and not uncomfortable). Producer inflation, however, was a little higher than expected. If not tamped down, it could lead to palpable consumer inflation. The annualized consumer inflation rate now stands at 2.8%... well above the 2.0% the Fed says it's targeting.
Annualized Inflation Charts
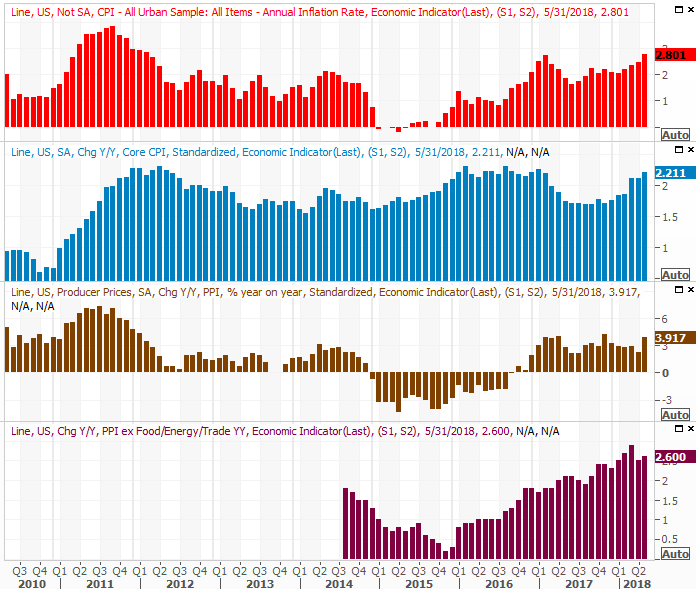
Source: Thomson Reuters
On Thursday we heard May's retail sales report' spending was much better than expected (about twice as much, by most measures). It appears consumers are ready to enjoy their wages. And yes, it's great news for the U.S. economy and its companies, which is about 2/3 consumer-driven. There's a "but" though.
Retail Sales Charts
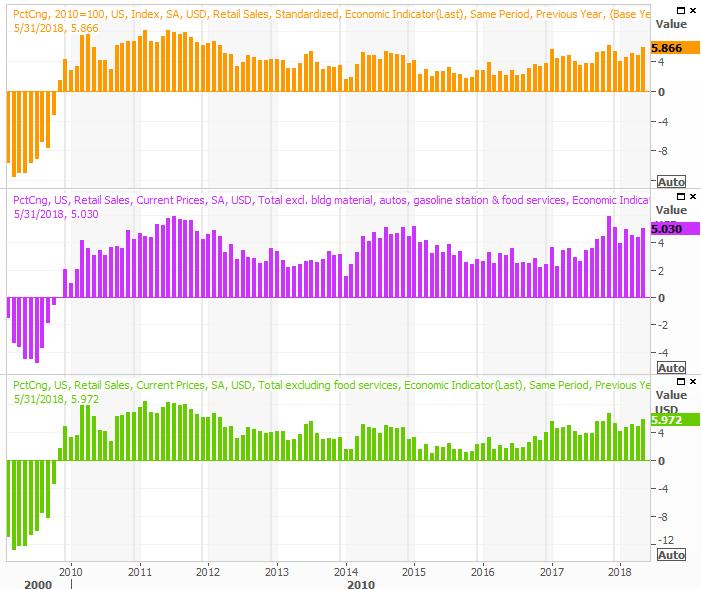
Source: Thomson Reuters
That "but" is the fact that the nation's industrial players saw something of a slow-down in May. Industrial productivity and capacity utilization were both down.
Industrial Productivity and Capacity Utilization Charts
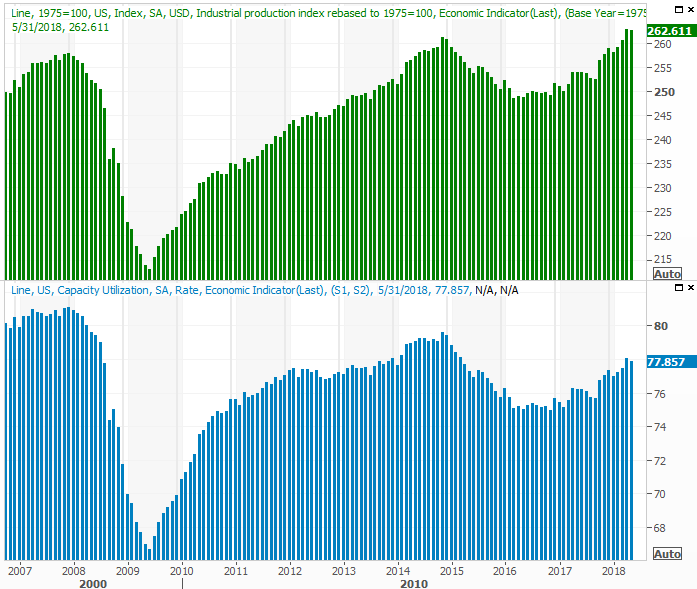
Source: Thomson Reuters
It's not the end of the world - one month does not make a trend. It's something worth noting, however, in that the correlation of corporate earnings and industrial activity is strong. If we're seeing contraction here, it won't be long until earnings mirror that weakness.
Everything else is on the grid.
Economic Calendar
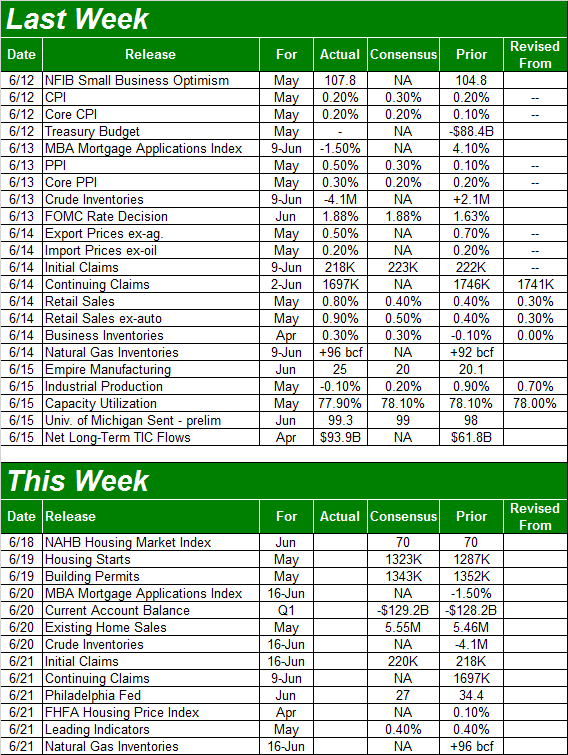
Source: Briefing.com
This week is going to be considerably less dramatic. But, it will be a huge one for the real estate market. Construction activity and home prices will both be dissected.
The housing starts and building permits reports will be posted on Tuesday. The pros think starts will ramp up, and permits will roll in level with April's tally. In both cases though, the bigger trend is still a bullish one.
Housing Starts and Building Permits Charts
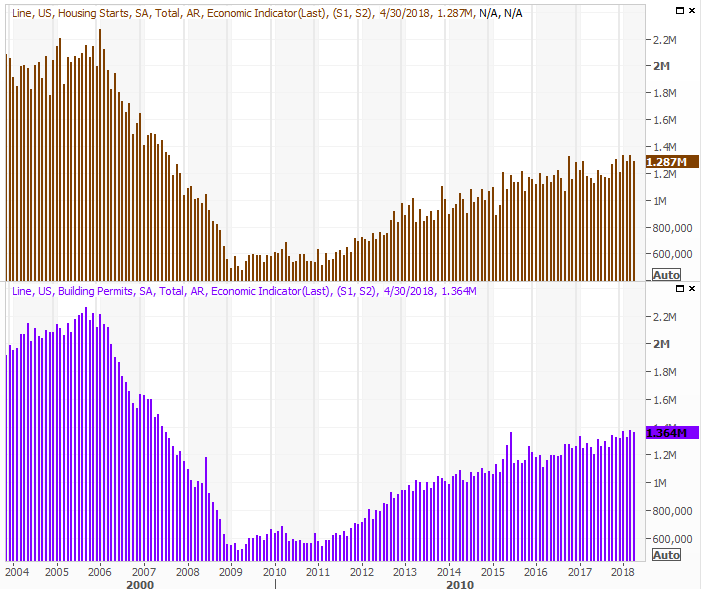
Source: Thomson Reuters
We'll also get updated looks at real estate prices, with the FHFA Housing Price Index report for April coming on Wednesday; look for another move higher.
Home Price Charts
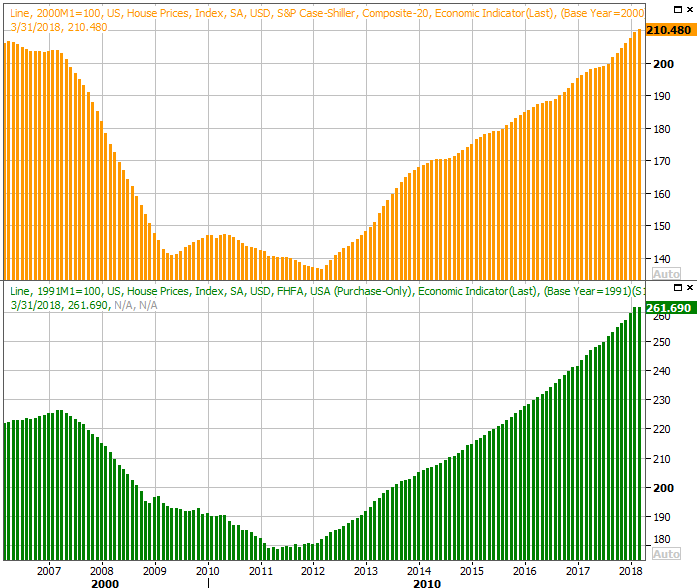
Source: Thomson Reuters
The Case-Shiller index for April won't be posted until next week, but as you can see, it's trending higher too. Though there's chatter that higher rates have been and will become a problem, and a lack of inventory is creating volatility, on balance, the real estate market remains healthy, and should for the foreseeable future.
Index Analysis
Impressive. Even when the market looks like it's trying to roll over, the bulls won't let it. Friday's pullback brought the S&P 500 to the brink of a major support line, but by the time the closing bell rang, the bulk of the intraday loss had been wiped away to leave the index up for the week.
That's not the most interesting aspect of the S&P 500's chart below, however.
Take a look at the daily chart of the index below. Namely, notice the orange lines that form a converging wedge pattern extending all the way back to April. This pattern has two opposing implications. On the one hand, it could be the build-up leading to a breakout thrust above the upper boundary of the pattern. On the other hand, it could be an ascending wedge pattern that's setting up a sizable breakdown that will start with a move under the lower boundary of the converging wedge shape.
S&P 500 Daily Chart, with VIX and Volume
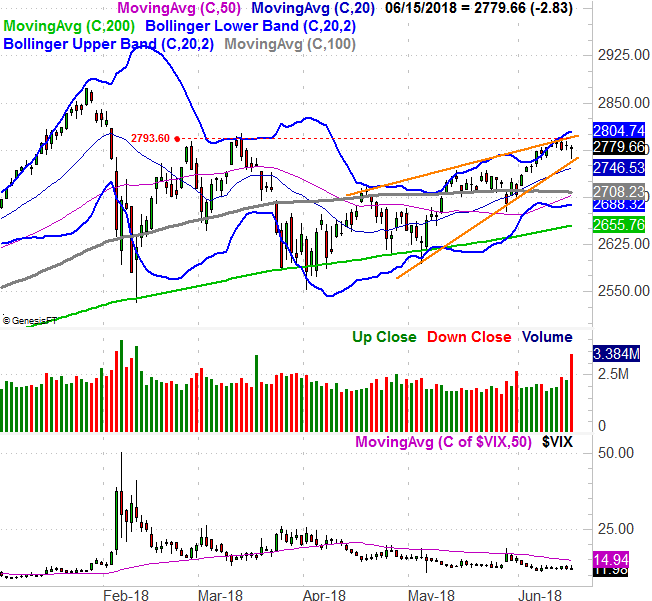
Source: TradeNavigator
Which will it be? That's the point - it's not clear yet. This slow back-and-forth within the rising trading range, however, sets the stage for a period of a much bigger move.
The bullish argument: The fact that the index is above all of its key moving averages... an idea better illustrated with the weekly chart. The market seems overbought (and is), but we only have to look back at last year and see the market can become overbought and remain so for months on end, and continue to rally. Rule nothing out. [The VIX also says there's at least a little more room for market upside before the VIX finds an absolute floor.]
S&P 500 Weekly Chart, with VIX and Volume
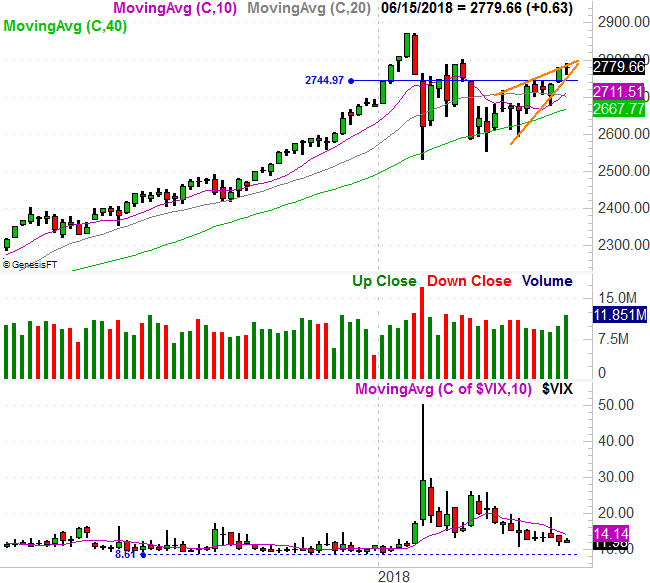
Source: TradeNavigator
The bearish argument: The calendar, volume, and the fact that the S&P 500 index is bumping into a recent peak. In reverse order...
Back to the daily chart, the March peak around 2794 (dashed) is being tested. It's not a huge technical hurdle, but one to respect. We've also talked at length about it at the website, but we'll reiterate now that June is typically a loser for the market. We'll also remind you that the June swoon usually doesn't start until the last half of the month. We've certainly set the stage for that outcome this time around.
As for the volume problem, in short, there's a lot more bearish volume than bullish volume here, but that's increasingly been the case for quite a while.
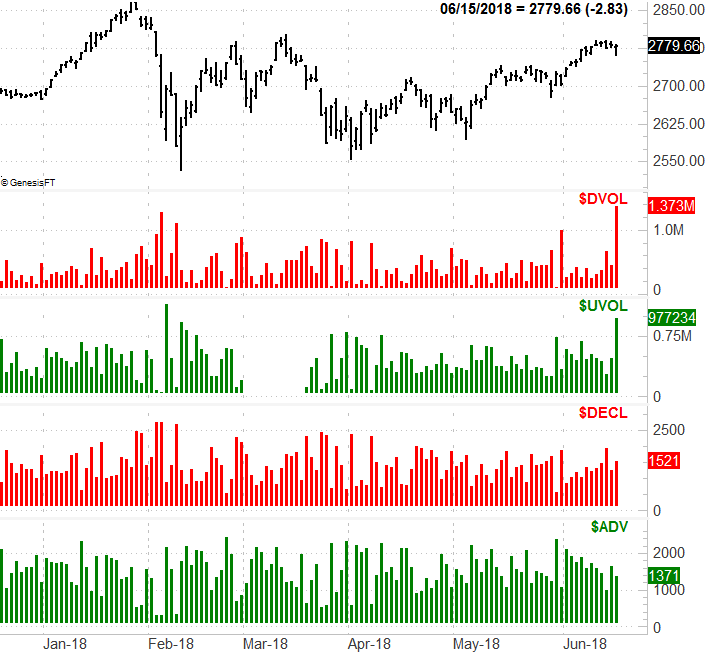
The chart below might be relatively familiar to you, plotting the S&P 500 with the NYSE's advancers and decliners, and the NYSE's "up" volume and "down" volume. Yes, there ended up being a ton of "up" volume on Friday, but that was a stroke of luck. The bulk of Friday's trading materialized on a downstroke, with some of that volume switching to "up" volume thanks to the late-in-the-day rallies that put enough stocks into the green for the day. Even so, even before Friday, the undertow was turning bearish even before stocks started to roll over on Wednesday.
S&P 500 Daily Chart, with NYSE Advancers/Decliners & Up/Down Volume
Source: TradeNavigator
Be prepared for anything this week, but mostly keep an eye on the converging wedge pattern evident on the daily chart. That being said, do know that any break out of that converging wedge pattern will likely make for a great trade, but isn't apt to last very long. Summertime isn't a great time of year for prolonged moves in any direction.