Weekly Market Outlook - The Least Opportune Time to Give Up
Whoops. For the better part of the first half of April, it looked like the market was going to make good on the recovery hints it dropped early in the month. Now that entire effort is being called into question. Though the rebound gain was never a move backed by high volume, a major hurdle that could have become a bullish catalysts was never cleared. Instead, traders backed away from it... in spades.
 Things could still go either way, but the bears have the edge again.
We'll dissect it below, as always, pointing out why we may have still not seen the ultimate, capitulatory bottom. First though, let's review last week's economic data and preview this week's economic announcements. There's one report in the cards that could make or break the market.
Economic Data
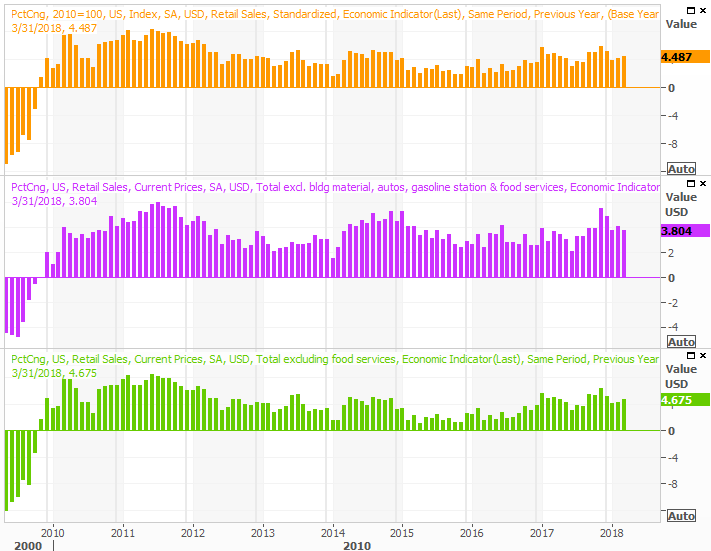
Last month's retail sales were... not red-hot, but solid. Even stripping out the positive impact of strong automobile sales, retail consumption grew 0.2% for the month. On a year-over-year basis, all retail spending was up 4.6% (not including restaurants). If you look closely, you'll see consumerism is picking up speed again.
Retail Sales YOY Growth Charts
Source: Thomson Reuters
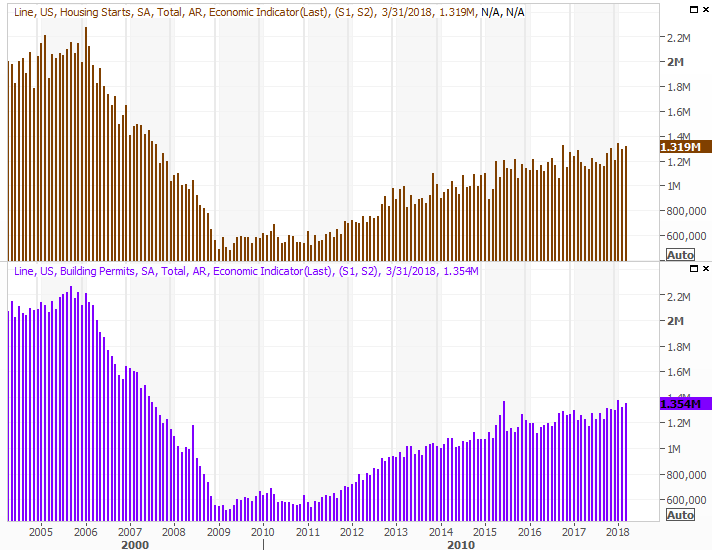
Real estate construction activity is also picking up steam. Housing starts and building permits were not only both up, extending a long-standing uptrend, both rolled in better than expected.
Housing Starts and Building Permits Charts
Source: Thomson Reuters
It's encouraging to see this much interest in homes against a backdrop of rising interest rates, though perhaps would-be buyers are pulling the trigger before rates edge any higher. We can't be presumptuous though. We have to assume the trend in place will remain in place until we clearly see it's not.
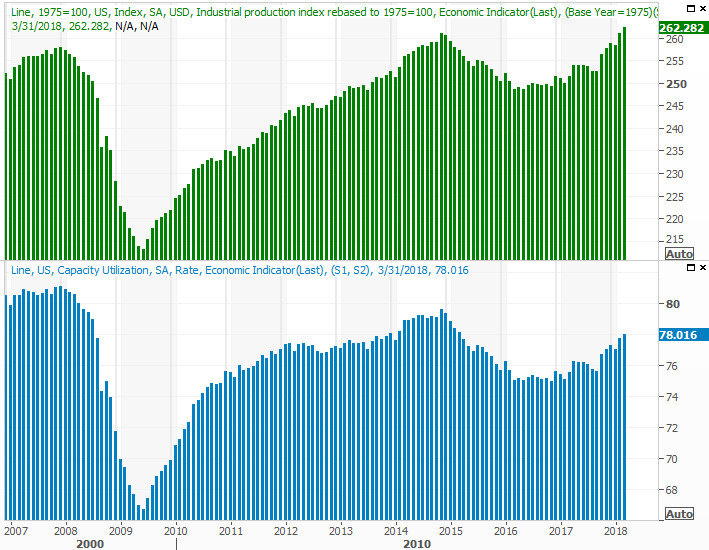
Perhaps last week's most important economic report was March's capacity utilization and industrial productivity figures. Production was up 0.5%, and the utilization of our factories grew from 77.7% to 78.0%. Both continue to race higher.
Capacity Utilization and Industrial Productivity Charts
Source: Thomson Reuters
We've mentioned before how this data, more so than any other, coincides well with corporate earnings as well as with the long-term market itself. While a good report won't stave off a near-term market correction, this data says the bigger-picture bull market is alive and well.
Everything else is on the grid.
Economic Calendar
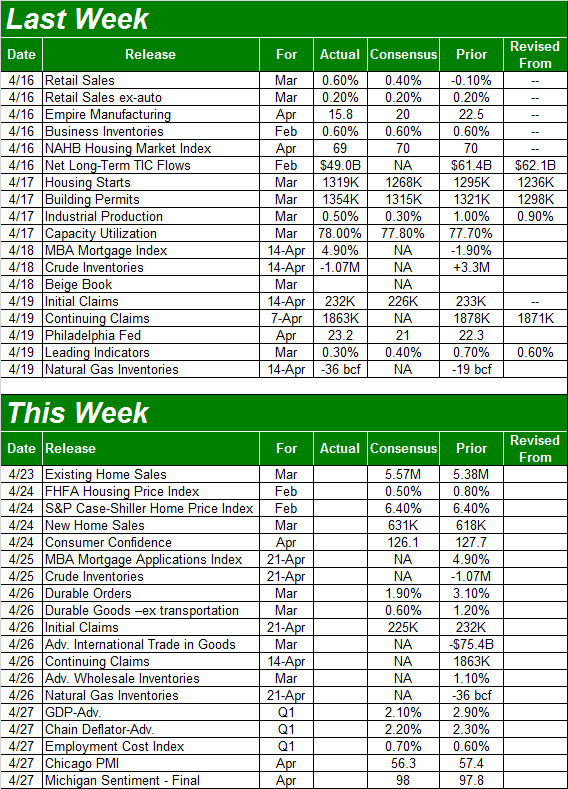
Source: Briefing.com
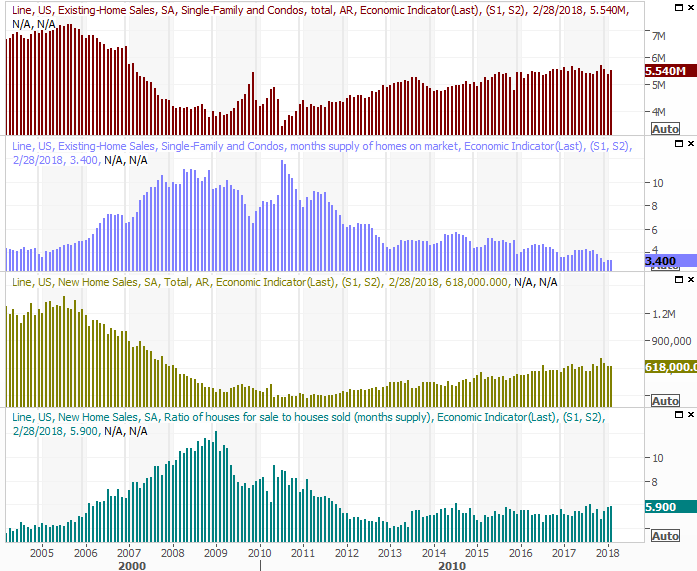
We'll round out the look at the current real estate picture this week with reports of March's new-home and existing-home sales. In step with March's starts and permits data (and the ongoing rise in home prices), economists expect sales of homes to edge upward again as well. Of the most interest here, though, we'll be the number of homes that actually are for sale. While limited inventory has helped buoy prices, it may have also kept home-sales growth from being as strong as it could be.
New and Existing Home Sales Charts
Source: Thomson Reuters
Notice that new home sales are driving most of the growth here, possibly because that's where most of the new inventory is materializing. That's good news for homebuilders.
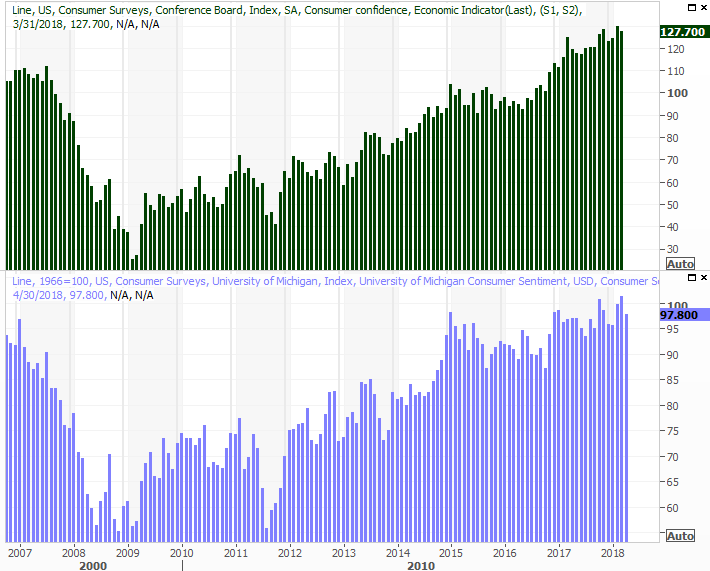
Also this week we'll get a good glimpse of how consumers are really feeling, via the April report on the Conference Board's consumer confidence measure, along with the third and final update of the Michigan Sentiment Index. Despite market turbulence and political uncertainty since January, consumers/investors have remained amazingly optimistic.
Consumer Sentiment Charts
Source: Thomson Reuters
Finally, though we're not going to give you a preview vis-a-vis a chart, know that we'll get the first estimate (of three) of Q1's GDP growth rate on Friday, and crude oil's inventory levels on Wednesday. Either could move the market, if the numbers are something different than expected.
Index Analysis
The market certainly isn't beyond the bearish tipping point just yet, though once again it's pointed in that direction. We may not have to stress out here, but we do have to respect the possibilities from here.
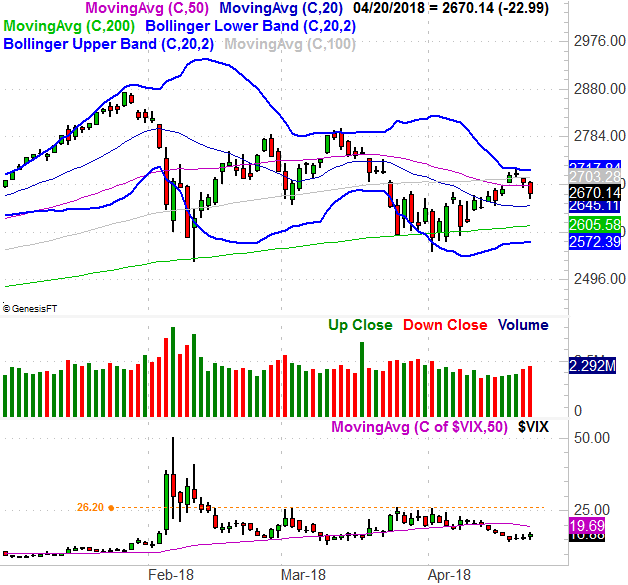
If we're being honest, there's nothing that should be surprising about last week's reversal from an uptrend into a downtrend. As was the case in March, all it took was a kiss of the upper Bollinger band to make the buyers think twice... not that there were a whole lot of them. As the daily chart of the S&P 500, the rally since early April was a low-volume affair, but the selling we saw for the last two (bearish) days of last week as above the recent norm. That is to say, a lot of people were bailing out of stocks at the drop of a hat last week.
S&P 500 Daily Chart, with VIX and Volume
Source: TradeNavigator
Thanks to Friday's weakness, the index is back below its 50-day moving average line (purple). Yet, that's not even the most troubling part of the market's present situation. Most concerning is how, despite a relatively painful blow to stocks late last week, the VIX didn't surge. A capitulatory market bottom is usually made with a surging VIX. The fact that traders aren't even close to panicking right now suggests they aren't exactly shocked the market started to roll over again.
If they're thinking weakness is no surprise, they may well act accordingly.
Zooming out to a weekly chart doesn't really tell us a whole lot more, but it does (once again) put things in perspective.
S&P 500 Weekly Chart, with VIX and Volume
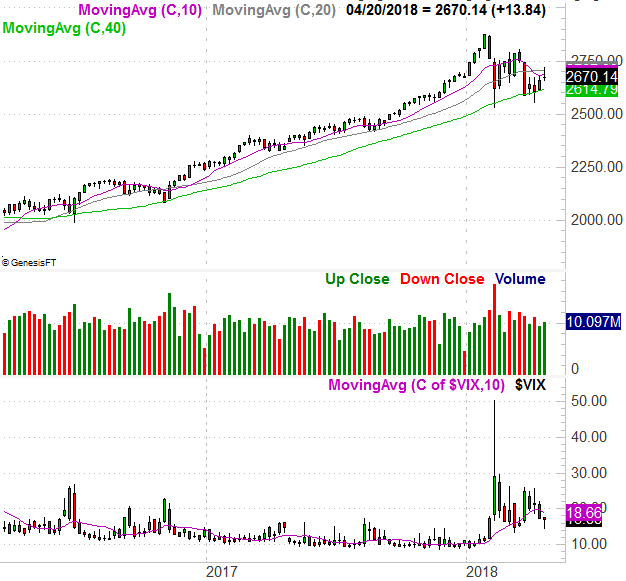
Source: TradeNavigator
So now what? We wait. The market remains very much on the fence, trapped between Bollinger bands and key moving average lines. The biggest of those moving averages is, of course, the 200-day moving average line (green) at 2605. The index was able to push up and off that line the last couple of times it was tested as a floor, but the bears are clearly going to continue forcing tests. As before, if the 200-day line is tested and fails to keep the market propped up, that should lead into a more serious - albeit short-lived - corrective move.
On the flipside, if and when the upper Bollinger band is finally hurdled as a ceiling, that should mark the beginning of a more prolonged rally.
Don't try to force a trade until we have more clarity here.