Weekly Market Outlook - One Misstep Away From Trouble, Or...
 Last week's marketwide loss was so minimal that it was negligible. But, sometimes what's not happening is as concerning as what is happening. And what's not happening right now is a follow-through on the bullish effort that took shape two weeks ago. That may have been the biggest weekly advance since November, but remember... that November rally set up what could only be described as a disastrous December. (But, at least that disastrous December turned into a great buying opportunity.)
That's not a prediction. Just a worry, with the S&P 500 hovering just above a major technical line in the sand.
We'll take a detailed look below - as always - after a look at last week's economic news and previewing this week's announcements.
Economic Data Analysis
A pretty busy week, with the Federal Reserve being thrown a curve ball early on. That is, last month's inflation was neither too hot nor too cold, falling short of expectations that price increases would be nearer the 'hot' end of the spectrum. The overall inflation rate now stands at 1.8%.
Consumer, Producer Inflation Charts
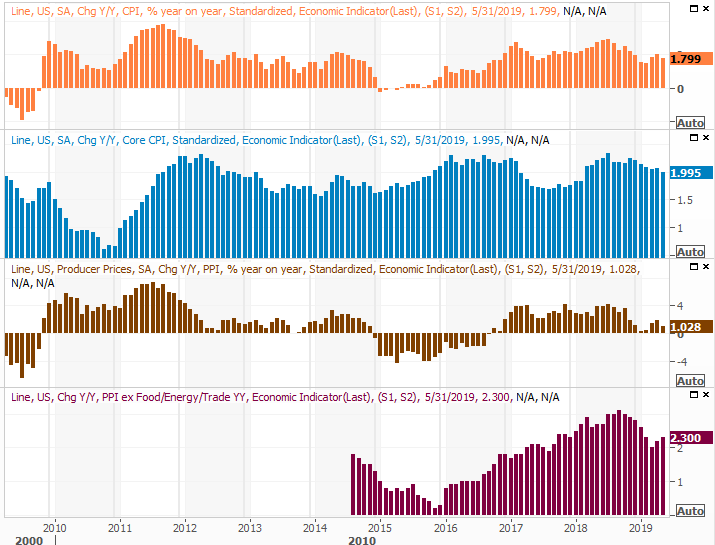
Source: Thomson Reuters
The Fed had been toying - allegedly - with a rate cut. Last month's data gives the nation's money and economic regulator even more room and reason to do so. Yet, cutting rates isn't without consequence either. In some regards, inflation would be a little stronger than it currently is. Fortunately most other economic data last week was strong, suggesting demand is healthy, and that supply may be in abundance.
Case in point? May's retail sales. They were solid again, up 0.5% on a month-to-month basis with or without auto sales factored in.
Retail Spending Charts
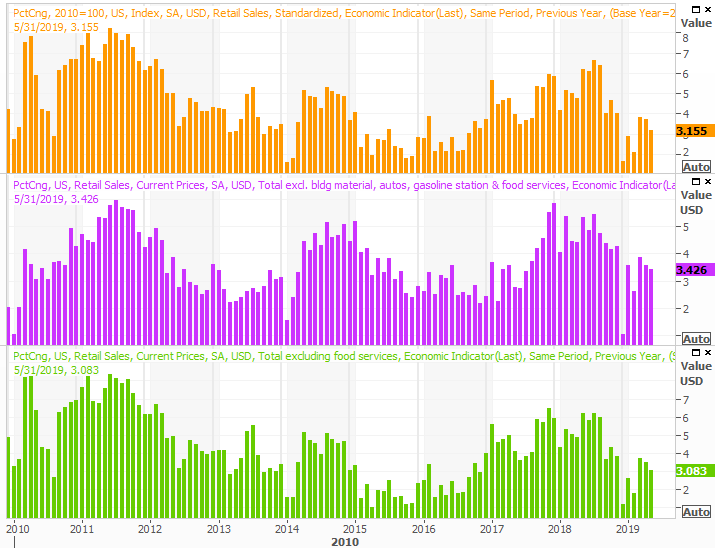
Source: Thomson Reuters
The year-over-year comparisons continue to fade, but that's largely a function of the phenomenal surge in spending we saw in 2017 and 2018. On an absolute basis, consumers are still doing their fair share of the heavy lifting despite the impact of steep tariffs.
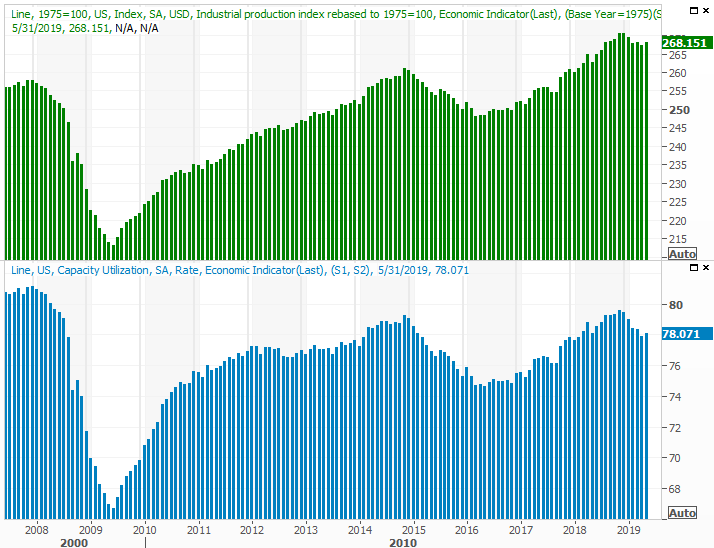
Bolstering the bullish case is last month's capacity utilization and industrial output. Both were up, and both were up more than expected, putting April's lull out of sight and out of mind. Last month's improvements, in fact, could mark an important pivot point for the better after several months of waning figures.
Capacity Utilization, Industrial Productivity Charts
Source: Thomson Reuters
Everything else is on the grid.
Economic Calendar
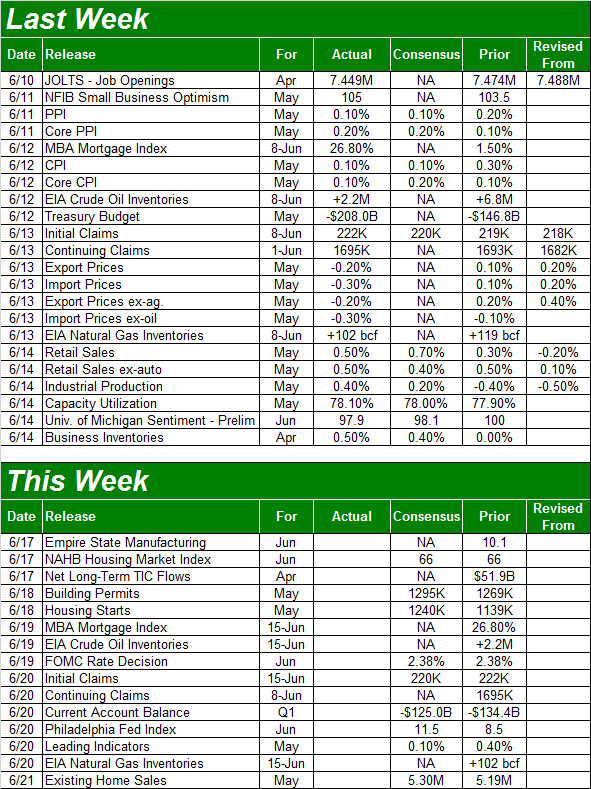
Source: Briefing.com
This week doesn't have a lot in store in terms of economic announcements, but one of the items in the queue is a biggie. On Wednesday we'll hear whether or not the Federal Reserve has decide to change the Fed funds rate or not.
As of the latest look, traders are saying there's a 23.3% chance the Federal Reserve will lower its target range by a quarter of a point, but that there's a 76.7% chance it will stand pat.
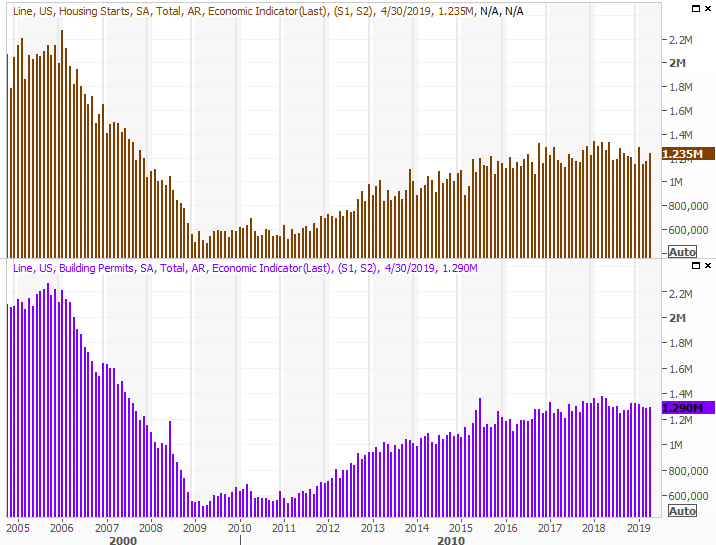
It's also a big week for real estate news, with last month's building permits and housing starts data due on Tuesday, and May's existing home sales report coming on Friday.
Economists are basically looking for more of the same on the permits front, but for same reason anticipate a strong uptick for starts. It may be a reflection of newly-secured mortgage loans prompted by a recent lull in mortgage rates. Whatever the case, although not losing ground, it's clear we're not gaining ground either. It forces one to wonder if the 2006 surge was a wild fluke, and if we're already at maximum sustainable construction activity.
Housing Starts and Building Permits Charts
Source: Thomson Reuters
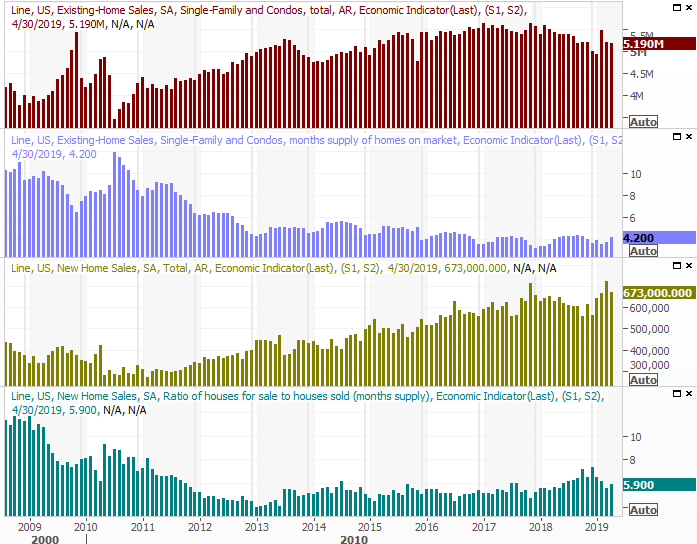
Friday's look at existing home sales numbers will only be rounded out next week when we get a look at May's new-home sales data. But, for this week's piece of the picture, analysts expect measurable though modest progress. It appears this aspect of the housing market has finally made a turn for the better; new-home sales have remained robust.
New, Existing Home Sales and Inventory Charts
Source: Thomson Reuters
It appears that new homes are the only viable option for many, with inventory of existing homes remaining quite suppressed, serving as a bottleneck. Given that trend along with still-rising home prices, it's possible the real estate market is stronger than it seems on the surface.
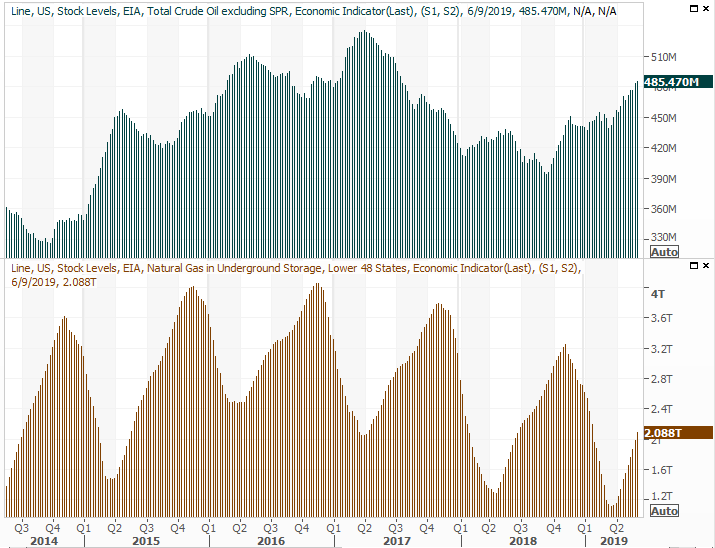
Finally, it's been a while since we've looked at it, so it might be worth a refreshed view of crude oil inventories.
They are, in short, on the rise at a faster clip than oil companies and oil investors might like to see. Though still nowhere near early 2017's peak, we're already back to the 2015 levels that threw crude prices into a nosedive.
Crude Oil, Natural Gas Inventory Charts
Source: Thomson Reuters
It is somewhat different this time. This time, there's less surprise, and the industry seems to have a little less 'standby' capacity ready to put into action at a moment's notice. The U.S. is exporting oil now as well, so it's possible inventory is being replaced at a faster pace now, with the market sensing the stockpile is less static.
Still, this much excess continues to pose a threat to the sector's profitability.
Stock Market Index Analysis
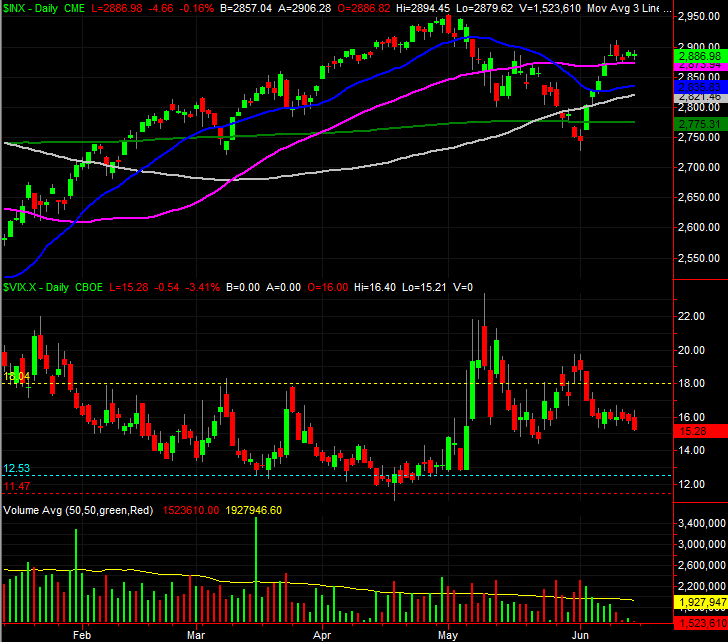
Two weeks ago, investors were cheering the impressive recovery. Stocks finished May on a sour note, hinting at more selling. The steep decline was abruptly ended before it had a chance to pick up steam though, with the S&P 500 moving back above the 200-day moving average line and then back above the 50-day moving average line (purple) early last week. However, once above that level, the rally effort came to a screeching halt.
S&P 500 Daily Chart, with VIX, Volume
Source: TradeStation
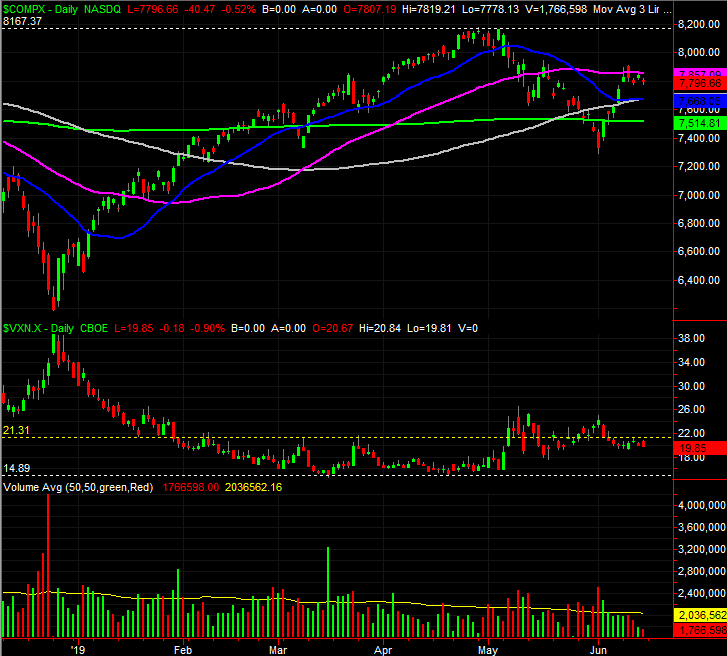
It's not thrilling, but serviceable. Except, the move isn't being mirrored by the NASDAQ Composite. It bumped into its 50-day moving average line last week, but was unable to remain above it.
NASDAQ Composite Daily Chart, with VXN, Volume
Source: TradeStation
Of the two indices, the NASDAQ is the one the bulls would want to see making more technical progress.
It doesn't mean a whole lot. Last week's daily volume was below average, and fell the whole time. Interest in the market at this time is modest, at best, and not especially bullish or bearish. The VIX is stabilizing too, at a relatively neutral 15/16 area. That's something of a no-man's land that sidelines a lot of traders. A break above 18 is still bearish, and a slide back to the 12-ish area also sets the stage for bigger bearishness. While the VIX is holding steady or falling toward the 12 level, however, is an opportunity for more bullishness.
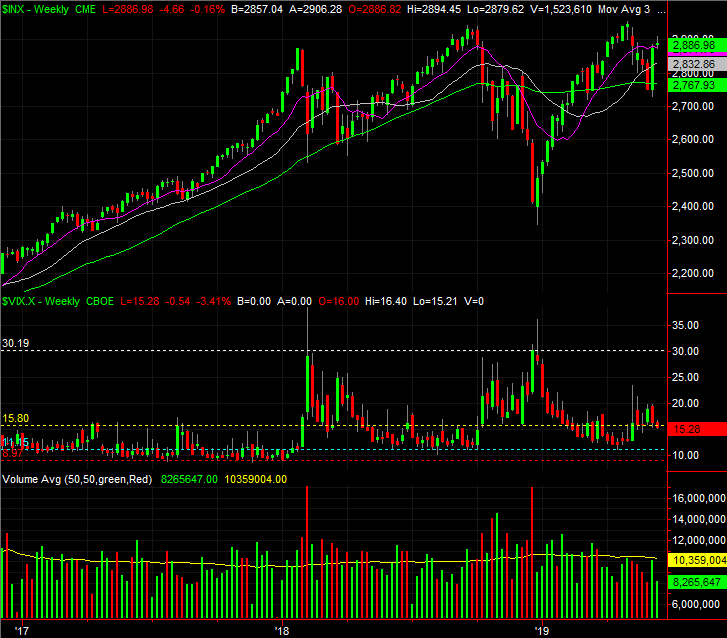
That's a concept that means more with the perspective offered by the weekly chart of the S&P 500.
S&P 500 Weekly Chart, with Volume
Source: TradeStation
The smart-money move here is to be patient. One side or the other will flinch soon enough, and we're at an ideal pivot point right now. That is to say, there's room and reason for the market to proceed up or down from here.
With all of that being said, also understand that the market could waffle for a few days while it figures out what's next. For the S&P 500, that means the index could bounce around between the 200-day moving average line around 2775 and 50-day line at 2878 for a while before a break finally takes shape. That volatility is the market's way of trying to unnerve as many traders before finally making a more prolonged move.
Just bear in mind that the action we've seen of late suggests a measured loss of bullish momentum and a test of the waters for a pullback. Keep your eyes peeled for crosses of shorter-term moving averages under longer-term ones. That's going to prompt bearish interpretations, especially here at the time of year when stocks are lethargic at best, if not prone to weakness.
One day at a time.