Weekly Market Outlook - Not the Follow-Through the Bulls Were Hoping For
Technically it was a win, thanks to the rebound effort that took shape late Friday. But, last week's 0.36% advance from the S&P 500 is a far cry from the prior week's 4.2% pop, calling the rally effort into question. And curiously, last week's highs are in line with an all-too-familiar technical ceiling.
Translation: There's still a significant enough risk the rebound effort that started to take shape in June could still fall apart, allowing stocks to make even lower lows.
We'll look at the lack of progress in detail in a moment. First, let's review last week's big economic news, and preview what's coming this week. Spoiler alert: Despite plenty of economic pitfalls out there, the jobs market remains surprisingly strong.
Economic Data Analysis
There were only two sets of economic data of any real interest last week. As was noted though, one of them - jobs - was one of these reports, and a big one... and a good one. The nation added (net) 528,000 payrolls in July versus expectations of only 250,000, which was enough to drive the unemployment rate down from 3.6% to a tie for a multi-year record of 3.5%. Although not shown on the chart below, the length of average workweek as well as wage growth remain quite healthy.
Payroll Growth and Unemployment Rate Charts
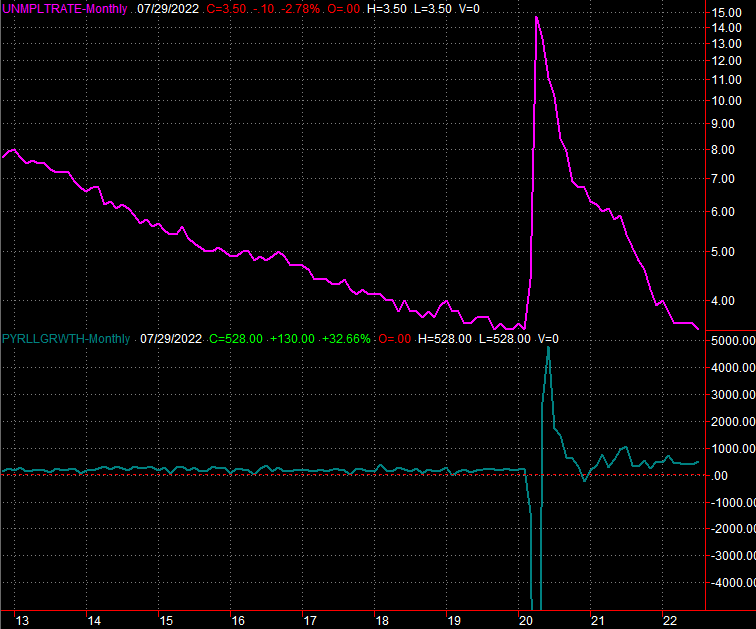
Source: Department of Labor, TradeStation
The data presents something of a conundrum for the Federal Reserve. The Fed's FOMC has already upped the Fed Funds Rate by 150 basis points in just two months in an effort to tamp down inflation, but last month's employment figures should keep consumer-driven price growth at fairly frothy levels. The Fed might be forced to keep raising rates, which still ultimately works against economic growth. The worry here is (or should be) that the impact will be sudden, without warning.
The only other item of interest dropped last week is the Institute of Supply Management's measure of services and manufacturing activity. The manufacturing index edged a little lower, but the services index surprised everyone by not tumbling, but jumping from 55.3 to a 56.7. Both indices are above the critical 50 level too, suggesting economic growth despite a bunch of economic red flags.
ISM Manufacturing and Services Index Charts
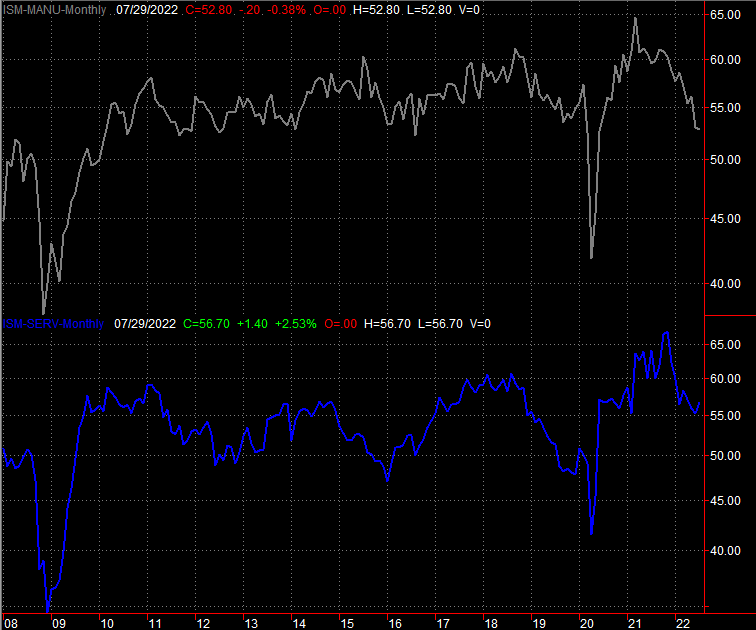
Source: Institute of Supply Management, TradeStation
Everything else is on the grid.
Economic Calendar
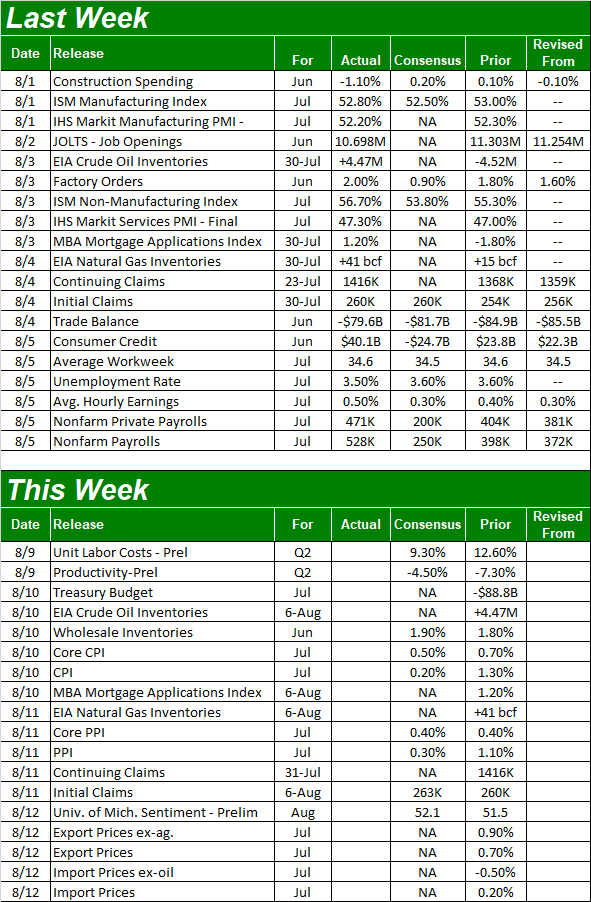
Source: Briefing.com
There's not a lot of economic data in the cards for this week, but interest rates remain front and center. On Wednesday we'll hear from the Bureau of Labor Statistics about last month's consumer inflation, followed on Thursday with the producers' inflation report. Don't look for any major change on either front on an absolute level. Any seeming slowdown in terms of cost will mostly reflect the fact that we're around the one-year mark where prices really started to run out of control. On a relative basis things will start to sound and look more affordable, but these slightly lower inflation numbers hardly reflect lower prices.
Consumer and Producer Annualized Inflation Rate Charts
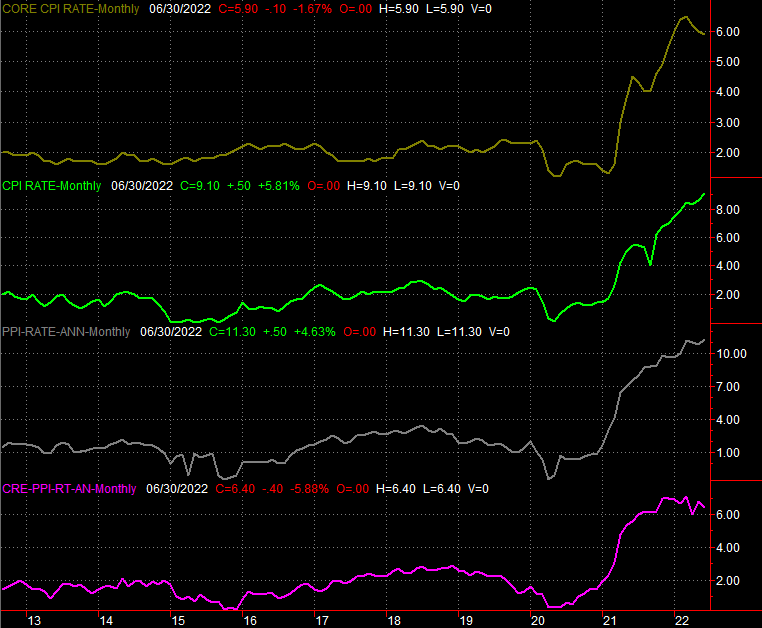
Source: Bureau of Labor Statistics, TradeStation
Stock Market Index Analysis
We kick off this week's look at the market by honing in on the daily chart of the S&P 500, since this best illustrates last week's biggest success. The bears had a chance to drag the index back below the 100-day moving average line (gray) it hurdled two weeks ago. But, after some heated back and forth action, the S&P 500 still managed to end the week above that long-term line. The daily chart also shows us the S&P 500's Volatility Index (VIX) finally broke under the rising support line (blue) that had been keeping it propped up since January. Both bode bullishly.
S&P 500 Daily Chart, with VIX and Volume
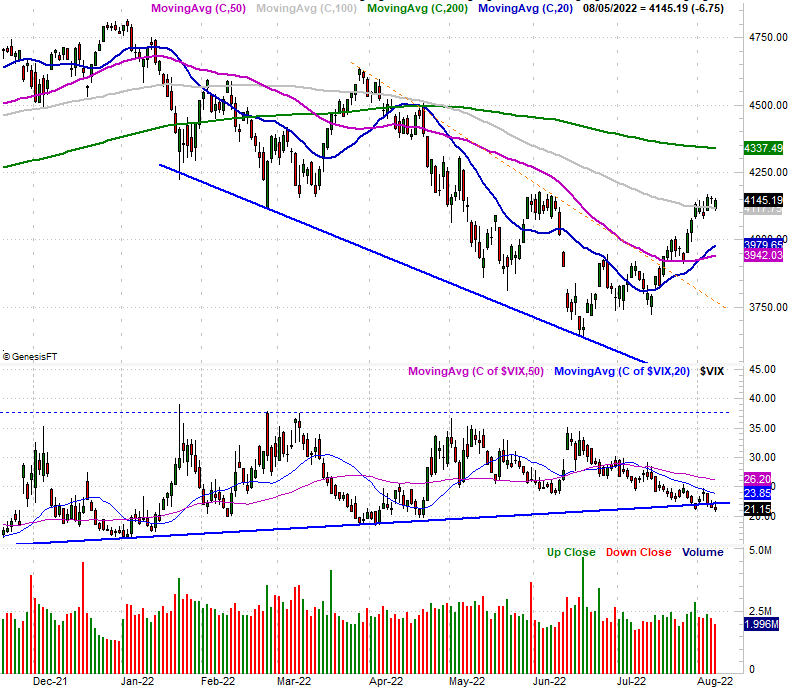
Source: TradeNavigator
Something else shows up when you zoom out to the weekly chart of the S&P 500, however.... Something bearish. That is, last week's high of 4168 is effectively in line with the index's peak in late-May and early-June. Perhaps without even realizing it, traders may have drawn a mental line in the sand there.
S&P 500 Weekly Chart, with VIX and Volume
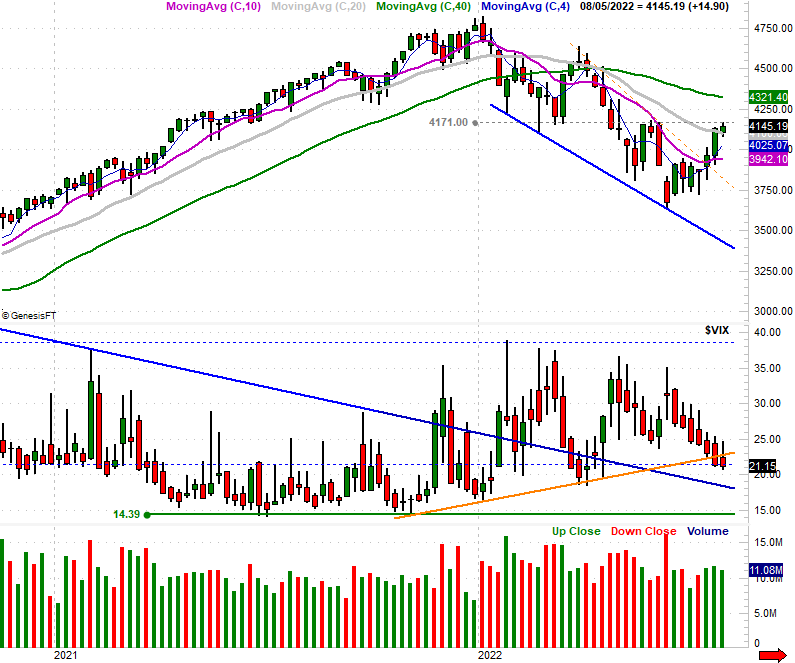
Source: TradeNavigator
And that's not the only place they've done so. Check out the daily chart of the NASDAQ Composite. It's also cleared its 100-day moving average line (gray), but last week's peak took shape right in line with the last couple of major highs (orange).
NASDAQ Composite Daily Chart, with VXN
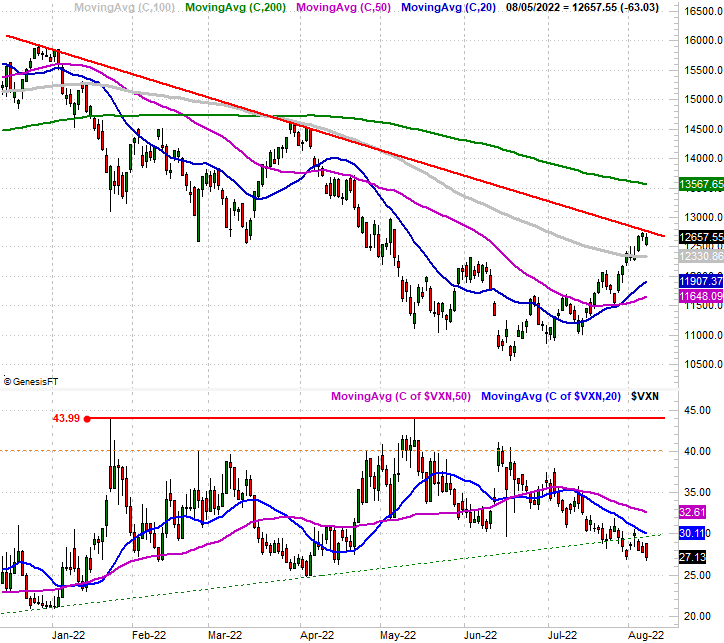
Source: TradeNavigator
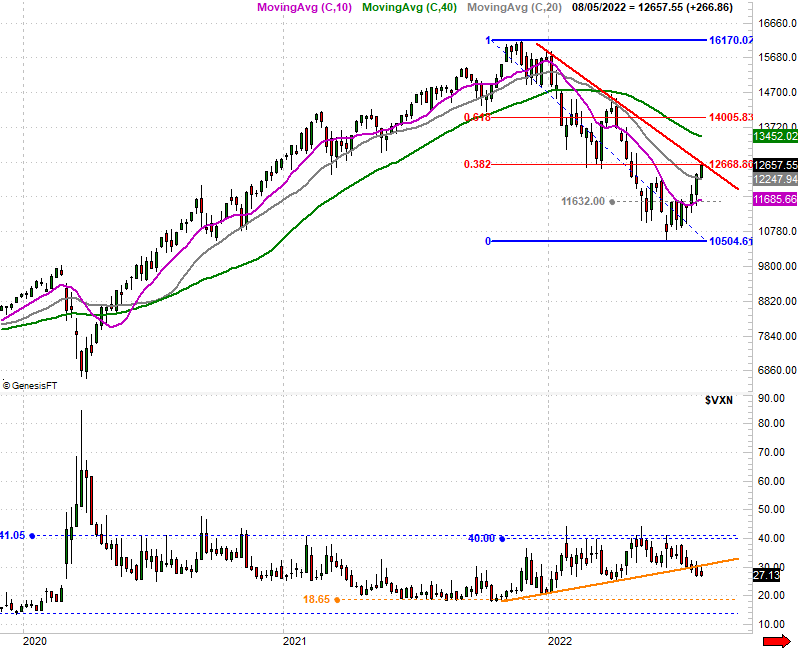
Here's the weekly chart of the composite, with one addition -- Fibonacci retracement lines (a retracement of the pullback from November's peak to June's low). The bounce from June's bottom to last week's high is a perfect 38.2% retracement of that move, which is a likely place for the bears to make their stand.
NASDAQ Composite Weekly Chart, with VXN
Source: TradeNavigator
In a similar vein, note that the NASDAQ's volatility index -- while under its intermediate-term support level (orange) -- didn't make a lower low last week.
It's becoming a bit cliché at this point, being something we've seed many, many times this year already. But, this week is a pivotal one. Both of the indices are dancing with key technical resistance lines, but both also have the advantage of bullish momentum, although not nearly as much as they had just a week ago. Just don't overreact to any weakness, if that's what we see this week. The advance is due for a breather, but taking a break doesn't necessarily mean a new pullback is underway.