Weekly Market Outlook - Last Week Wasn't a Loss, But It Certainly Wasn't a Win Either

The market may have logged a gain last week, but it was hardly the sort of advance the bulls would have liked to have seen. Stocks ended the week struggling to continue moving forward, and (still) hinting that the buyers are running out of steam.
Nevertheless, all the indices remain above critical technical support, although at least one is now starting to test those floors.
We'll look at this struggle in some detail below, as we always do. First though, let's run down last week's biggest economic announcements and preview what's coming this week, also as we always do.
Economic Data Analysis
While none of last week's economic reports could be considered "grand slam" important, several of them were bigger than investors generally appreciate.
Case in point: Capacity utilization and industrial production numbers from the Federal Reserve. This data's direction generally moves in tandem with corporate earnings and the longer-term market trend (though it doesn't sway short-term ebbs and flows). After slipping in October, last month both moved to their best levels since the pandemic took hold. This is a great sign that the economic rebound is getting traction.
Capacity Utilization and Industrial Productivity Charts

Source: Federal Reserve, TradeStation
It's not just the country's factories that are busier than they've been for a year and a half either. The nation's consumers are busy too. Last month's retail spending not only grew, but trounced estimates. In fact, although inflation helped a bit in this regard, total spending moved to an all-time record in November no matter what sort of consumption you count or don't count (food, gas, automobiles, etc.)
Retail Sales Charts
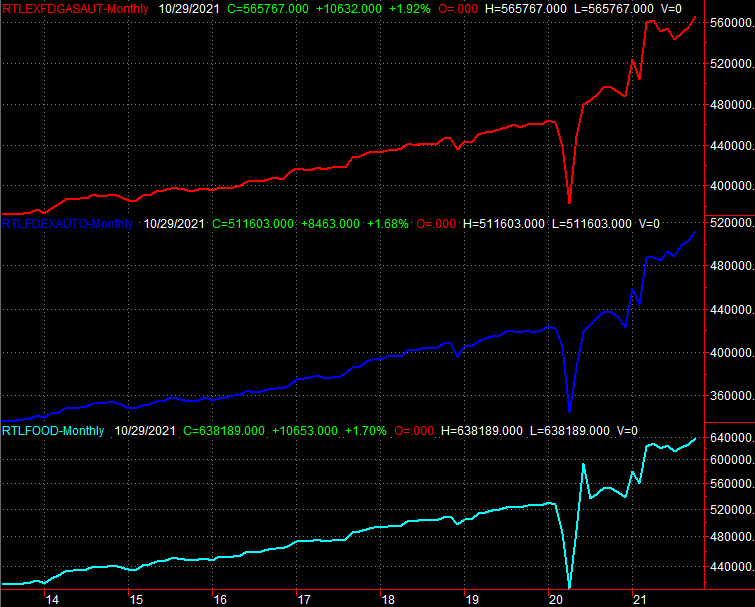
Source: Census Bureau, TradeStation
The one area where consumers aren't upping their overall expenditures is housing. After several months of brisk growth, housing starts and building permits remain muted. The number of building permits issued last month did improve from September's levels, but both starts and permits remain at or near multi-month lows.
Housing Starts and Building Permits Charts
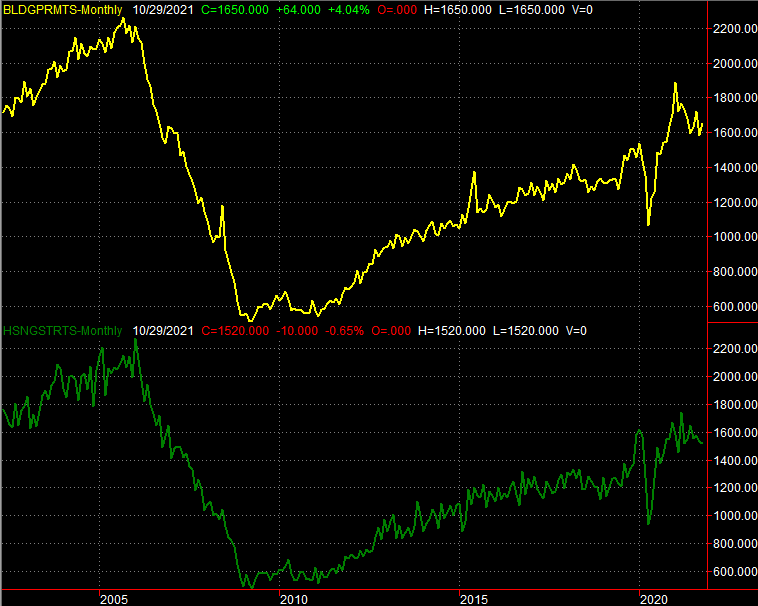
Source: Census Bureau, TradeStation
It's a reasonably good bet that uncomfortably high housing prices account for at least part of the slowdown, though it's also arguable the market simply already met all the need it's going to feasibly be able to meet in the buying spree seen late last year and early this year.
Everything else is on the grid.
Economic Calendar
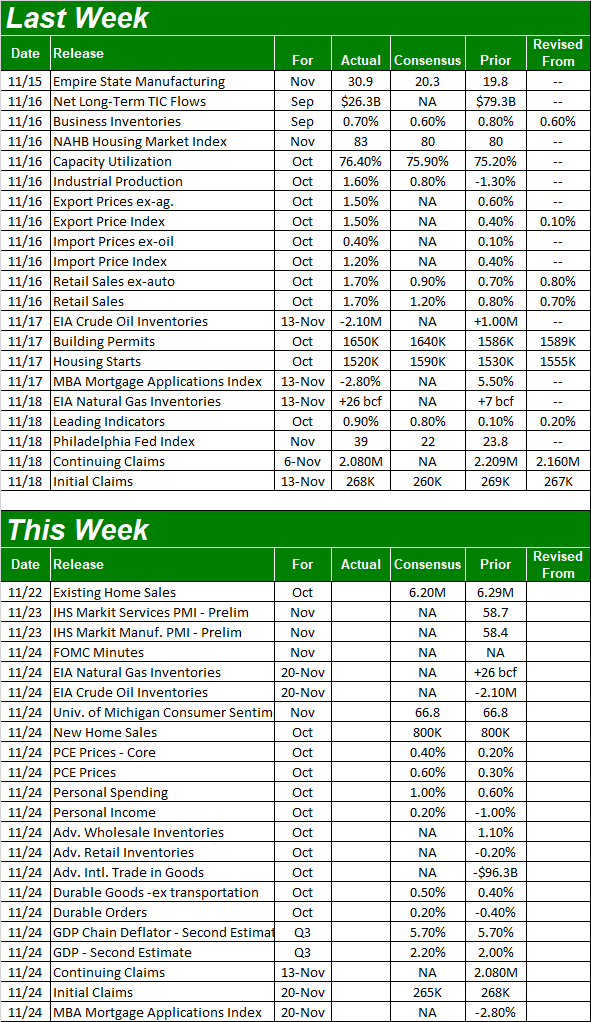
Source: Briefing.com
That theory is going to be somewhat tested this week by new home sales and existing home sales figures. While both are expected to more or less match September's data, bear in mind that September's figures were reasonably strong... certainly stronger than the lull seen around the middle of this year.
New, Existing Home Sales Charts
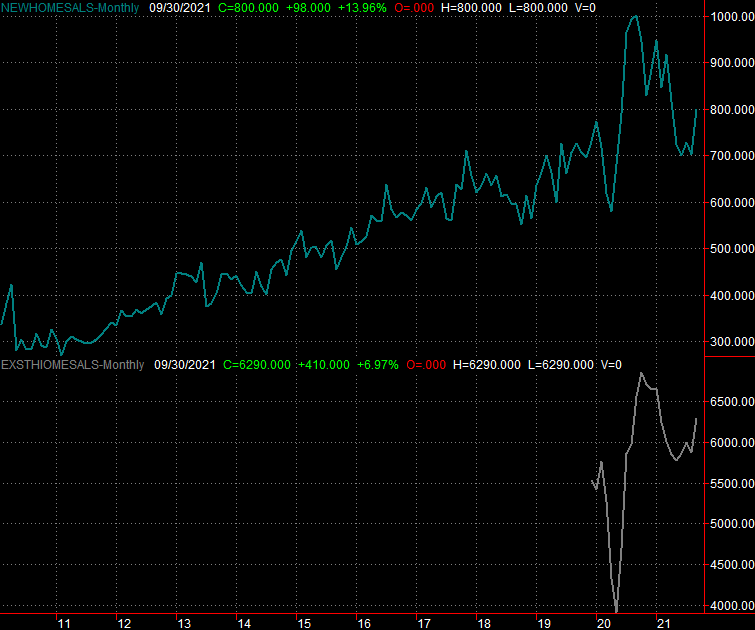
Source: Census Bureau, National Association of Realtors, TradeStation
The home sales trend jibes with the point being made about starts and permits. That is, anybody who was going to buy a house likely already did so, in light of last year's swell of purchases. The comparatively low figures we're seeing now - and probably will see again for October - aren't exactly "bad."
Also be alert for the release of the minutes from the last FOMC meeting on Wednesday. Although it's not a scheduled time to change interest rates (although the committee can do so at these meetings if they choose to), the language being tossed around at these meetings can change. Such changes are subtle clues as to the Fed's next move.
Stock Market Index Analysis
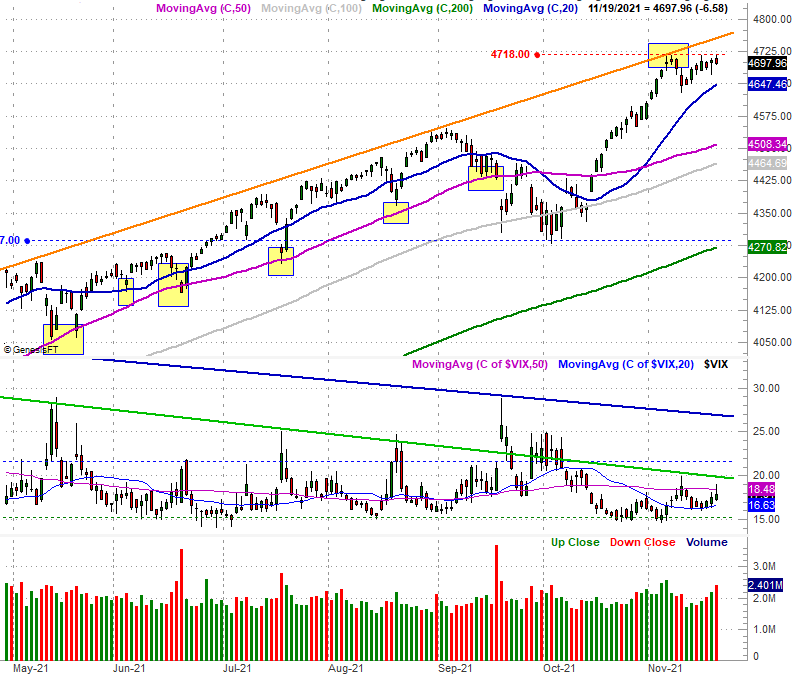
The S&P 500 logged a gain last week, but just barely, and unconvincingly. All told the world's most familiar market barometer closed a mere 0.3% above the previous Friday's close, giving up the bulk of what was at one point nearly a 0.7% gain.
That stumble may be more meaningful than it seems on the surface, particularly given the context. That is, the market bumped into a major technical ceiling a couple of weeks ago, and failed to hurdle it. Last week's second-wind effort didn't do much to change the situation. In fact, the shape of Friday's bar underscores the possibility that a new top (almost a double-top or even triple-top at 4718, marked with a red dashed line) may be taking shape right now in front of a more significant pullback. That shape is on open well below the high, and a close even lower than the open. Take a look.
S&P 500 Daily Chart, with VIX and Volume
Source: TradeNavigator
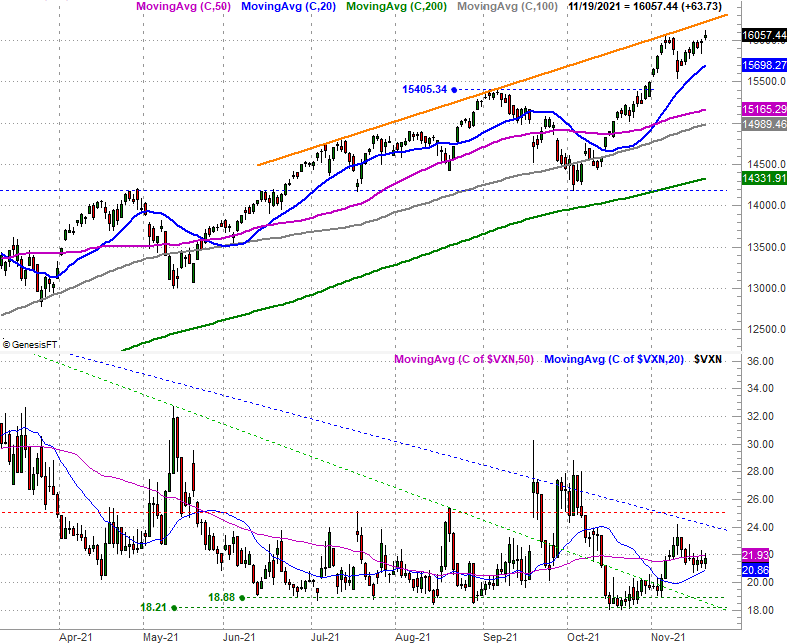
The NASDAQ Composite fared much better. Specifically, the index logged a gain of 1.2% for the five-day stretch, cracking a new record-high in the process. Even so, the intraday reversal of Friday's bar suggests traders are starting to sell into the strength.
NASDAQ Composite Daily Chart, with VXN
Source: TradeNavigator
And this isn't the only hint that the rally is running out of more steam than it seems on the surface. As we've discussed a few times in the Weekly Market Outlook of late as well as at the website, participation in the advance continues to wane.
We've measured this trend at a highly detailed level, looking at the NYSE's daily up and down volume, and separately, the NYSE's daily advancers and decliners. There's no getting around the reality: Advancers and bullish volume are sinking, and while decliners and bearish volume are growing. These trends were relatively evident before last week began. They've only become more evident in the meantime.
S&P 500 Daily Chart w/ NYSE Advancers and Decliners, Up and Down Volume
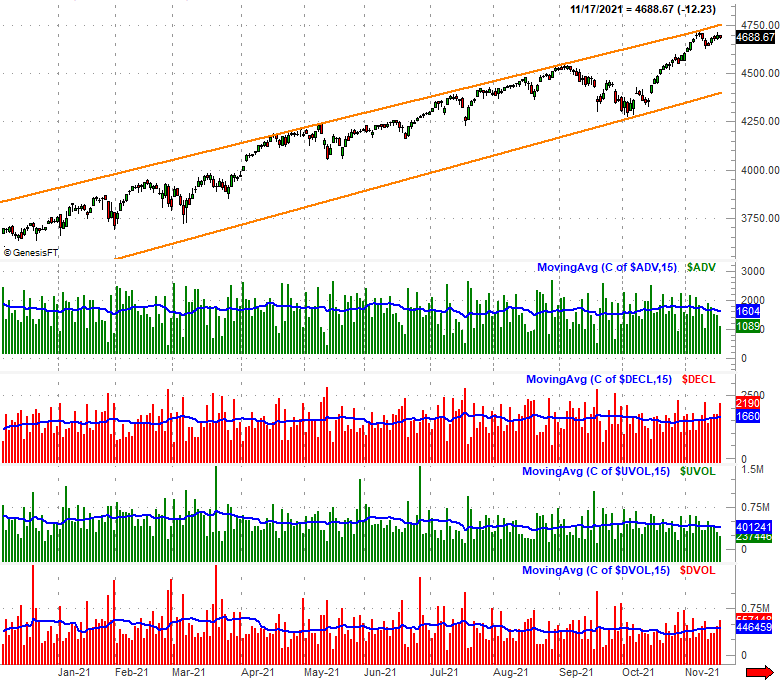
Source: TradeNavigator
There's a long way to go before any of these red flags evolve into full-blown alarm. Not only are both of the indexes in question still above all of their key moving average lines (which are also technical floors), both of the volatility indices -- the VIX and the VXN -- are below technical resistance. Both of these prospects would have to materialize before we can even start to think the market is headed for trouble. Nevertheless, it's a possibility we have to put and keep on our radars.
That being said, the weekly chart puts/keeps things in perspective. Even if the rally starts to unravel, there's tons of wiggle room. The lower edge of the S&P 500 trading zone (framed in orange below) is currently at 4400. The index could tumble more than 6% and still remain in its bigger-picture uptrend. In a similar vein, the VIX still needs to break above its falling ceiling at 27.0 before a selloff turns into much bigger trouble.
S&P 500 Weekly Chart, with VIX and Volume

Source: TradeNavigator
This remains a day-by-day affair.