
It now looks like the firm bullishness from two weeks ago wasn't a sign of better days after all. Last week's 5.0% selloff from the S&P 500 marks the worst week for stocks since January, and that ill-fated January week was the worst since the market tumbled in early 2020 in response to the spread of COVID-19 outside of China.
In other words, it was bad.
The $64,000 question is, of course, will it last? Is this a sign of what's to come? We'll explore that prospect below, though we'll warn you now there's not a lot of certainty with the clues we can glean here. Stocks are still squarely trapped between a rock and a hard place. Before we get to any of that though, let's look at last week's key economic announcements. You likely already know, however, inflation remains sky-high.
Economic Data Analysis
The inflation report, in fact, was the only major economic news released last week... though it was enough.
Simply put, we're still neck-deep into price increases. Overall consumer inflation reached a multi-decade high of 8.6% last month. Moreover, stripping out the impact of volatile food and gas prices, consumers' costs were up 6.0% year over year. That's more than brisk, prompting some economists to argue the Fed should - and possibly could - raise the Fed Funds Rate to the tune 75 basis points (0.75%) when it's scheduled to make a rate decision on Wednesday of next week.
Consumer and Producer Inflation Rate Charts
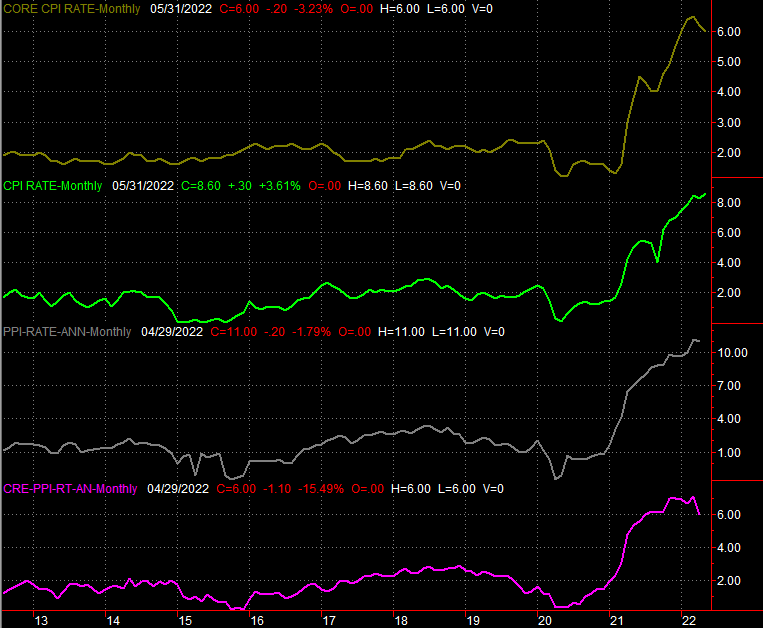
Source: Bureau of Labor Statistics, TradeStation
The Bureau of Labor Statistics will post the producer inflation figures for May the day before that, on Tuesday, although that's unlikely to alter the Federal Reserve's decision on interest rates (which has already been made). Besides, given the consumer inflation figures, most everyone agrees that the country's factories and assembly plants and production facilities are indeed still dealing with much higher input and operating costs.
Everything else is on the grid.
Economic Calendar
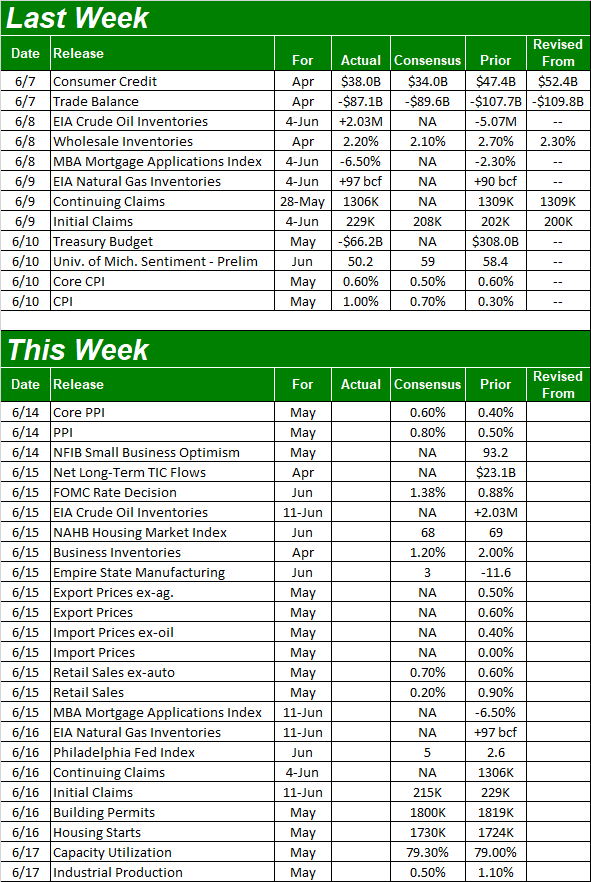
Source: Briefing.com
Aside from Tuesday's producer inflation figures and Wednesday's rate decision from the FOMC, this week is still going to be a big, busy one.
On Wednesday, for instance, we'll hear about last month's retail spending. Look for more growth, although much of this growth can be attributed to rising prices more so than growing net demand.
Retail Spending Charts
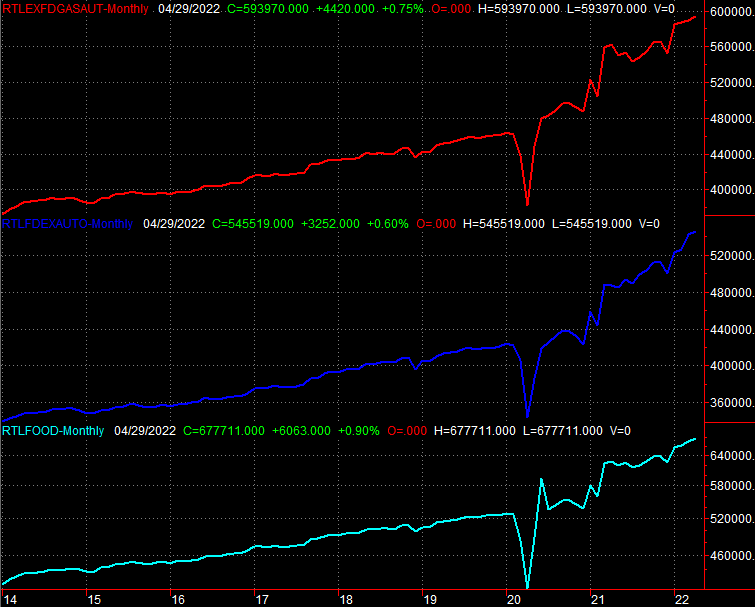
Source: Census Bureau, TradeStation
On Thursday look for building permits and housing starts. May's figures should closely match April's figures, which weren't that bad. Just be careful here all the same though. Some real estate figures -- like inventory -- are starting to show cracks.
Building Permits and Housing Starts Charts
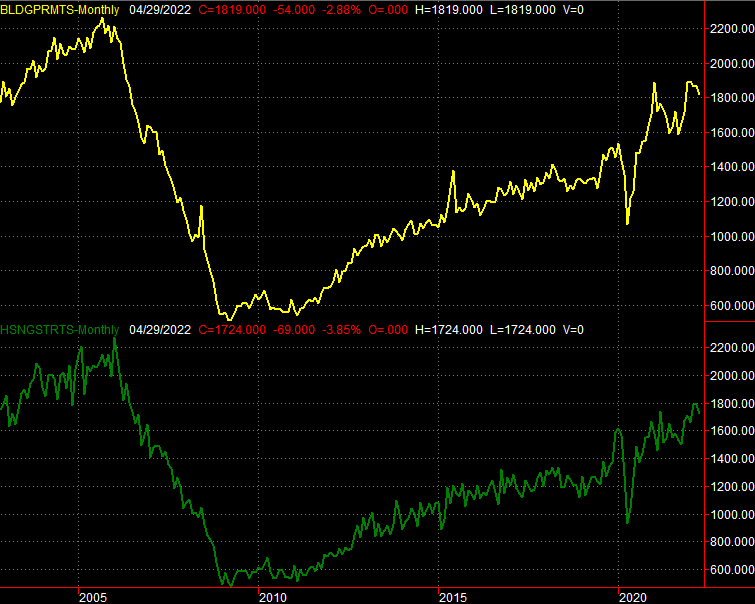
Source: Census Bureau, TradeStation
Finally, on Friday we'll hear from the Federal Reserve about last month's capacity utilization and industrial productivity. Capacity utilization inched a little higher, although actual production output growth cooled just a bit (but is still expected to be up for May).
Capacity Utilization and Industrial Productivity Charts
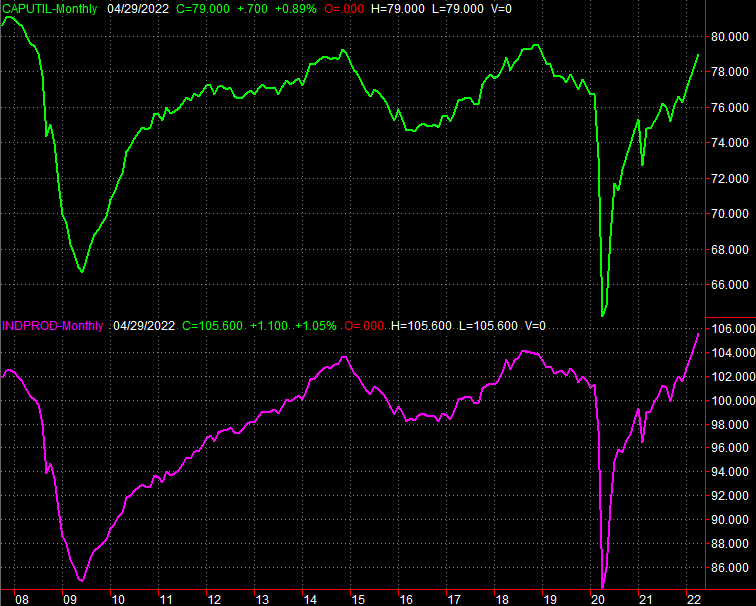
Source: Federal Reserve, TradeStation
This is important and encouraging data. The correlation between this data and corporate earnings and the long-term market trend is surprisingly tight, so to see forward progress with these numbers is ultimately good news even if the market hasn't been and performing like it isn't.
Stock Market Index Analysis
Thursday's stumble was painful, but not necessarily devastating; we've survived worse. Friday's bearish follow-through of course makes things even more tenuous. Yet, it's still not insurmountable. The worst part about last week -- and the most bearish now -- is the fact that investor sentiment just suddenly "fell out of the box."
It's an idea we touched on at the website after Thursday's close, although it bears an updated look here in the Weekly Market Outlook. That is, the narrow trading range the major indices were trapped in for the better part of the past couple of weeks that's suggested mere indecision buckled at the end of last week, confirming bearishness.
Take a look at the daily chart of the S&P 500 below to see what we mean. The index had been "boxed in" between 4070 and 4166 ever since the late-May surge, indicating traders were in a holding pattern, waiting to see what was next, and considering upside as much as downside might be in store. These traders had a sweeping change of heart -- to the downside -- when the news turned a little sour on Thursday and Friday. Inflation is the key culprit.
S&P 500 Daily Chart, with VIX and Volume
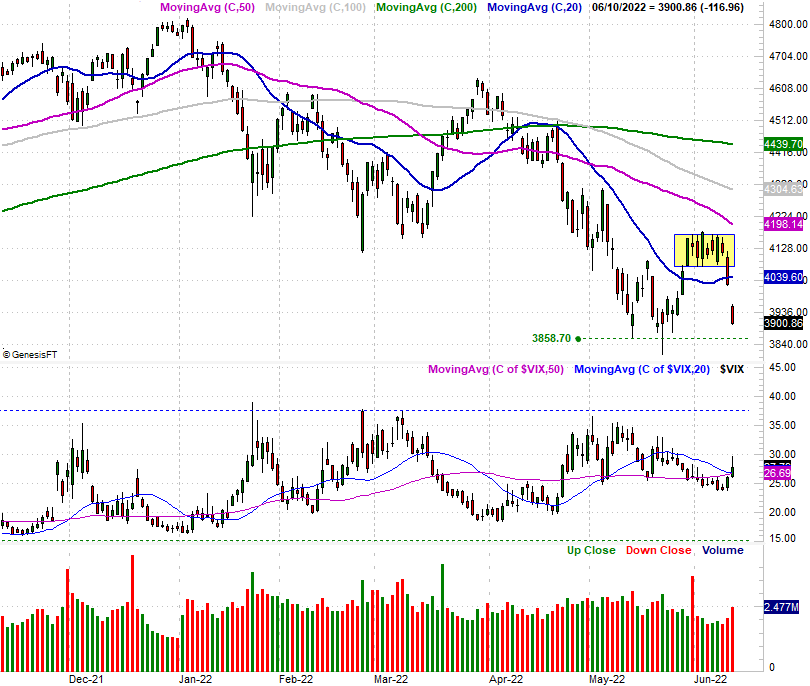
Source: TradeNavigator
Same story for the daily chart of the NASDAQ Composite. That is, the composite was simply traveling sideways while traders were waiting for clues as to the next move that made the most sense. They came to the firm conclusion on Thursday and Friday that their next move should be a bearish one. When the decision is this strong, it often "sticks." This is sort of what we saw in January, kicking off what turned into a prolonged pullback.
NASDAQ Composite Daily Chart, with VXN
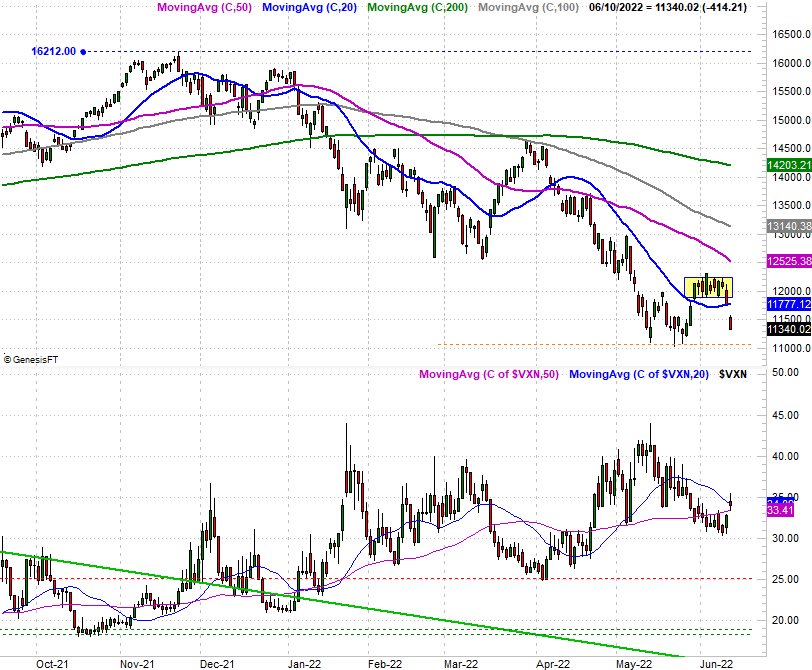
Source: TradeNavigator
Both volatility indices started to edge higher late last week too, which was something that had been missing from previous stumbles. With the VIX and VXN starting to push upward, it ups the odds that this market weakness could go somewhere.
And yet, it's too soon to count the market out, for a couple of reasons.
One of these reasons is, Friday's open was so bearish it left behind a major gap between Thursday's low and Friday's high. The market generally doesn't like to leave these "gaps" unfilled, which means sooner or later the S&P 500 should be pushed back up to close the gap. Friday's near-3% selloff and the 5.2% pullback suffered over the course of the last two days of last week was so bad that it sets the stage for a quick snapback now.
The other reason we don't want to assume stocks are too far gone to salvage is, the S&P 500 hasn't broken below its recently-established floor at 3858.7, while the NASDAQ Composite didn't pull under its floor at 11,052.
On the other hand, given the depth of last week's loss, both indices will now have to move above the upper boundaries of the "boxes" they just fell out of. For the S&P 500 that's still 4166. For the NASDAQ Composite, the technical resistance line in the sand to watch is 12,226. We're on the fence in the meantime, and the berth is wide while we wait. We could see a lot of headfakes within these wide ranges, waiting for the bulls or the bears to make a meaningful commitment to their position.
Here's the weekly chart of the S&P 500 for a little added perspective. From this vantage point we can see just how bad last week was. We can also see that the downtrend that took hold back at the beginning of the year never really stopped. The late-May gain was just a blip.
S&P 500 Weekly Chart, with VIX and Volume

Source: TradeNavigator
The weekly chart of the S&P 500 also shows us that its volatility index has also actually been trending higher since late last year, logging a streak of higher lows that's still intact.
As for how this week is going to get started though, it's anyone's guess. Headlines are apt to establish the direction.