Weekly Market Outlook - It Was Ugly, But It Worked
The bears had every reason and opportunity to deal something of a death blow last week, having ended the week before on low (bearish) note. But, Monday's bullish jolt bled through to Tuesday, and that was enough. Stocks didn't make any more progress the rest of the week, but the S&P 500 still ended the week with a 1.8%... and above some critical lines in the sand.
Still, this isn't the quality of progress the bulls would like to see. We'll discuss why below, after running down last week's big economic announcements and looking at what's in the queue for this week.
Economic Data Analysis
What a week! It was full of surprises, both good and bad.
Case in point: Economists were expecting the usage of the nation's factory and industrial output capacity to perk up, from 64% to 67.9%. They only got a fraction of it. Capacity utilization was only up to 64.8%. That was enough to improve production by 1.4% after April's 12.5% tumble. But, the forecasts called for a 3% increase. It suggests we're shaking off the impact of COVID-19, but it's happening very slowly.
Capacity Utilization and Industrial Production Charts
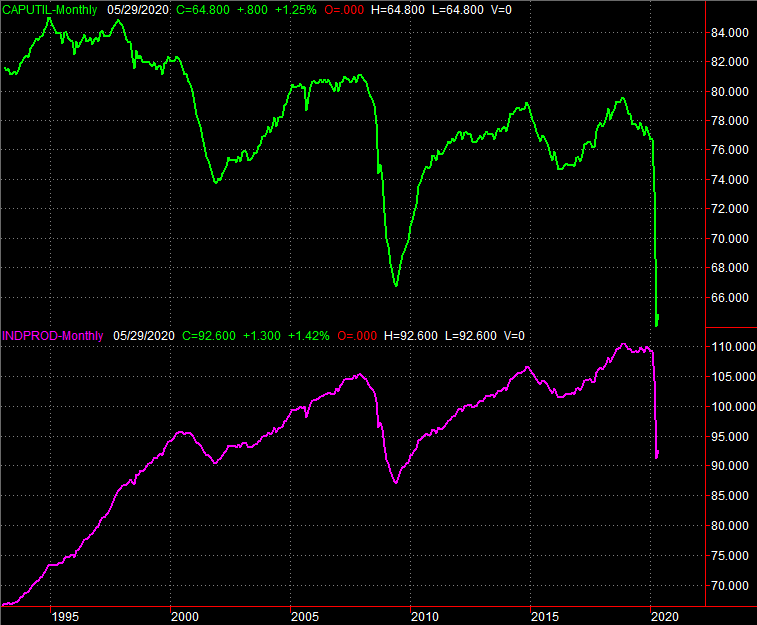
Source: Federal Reserve, TradeStation
It wasn't all mixes messages though. Take retail sales for instance. They tanked in April, as was to be expected. But, they snapped back in a huge way last month... far greater than anybody believed would happen. Overall they improved 17.7%, and even taking cars out of the equation, consumers found a way to spend a whopping 12.4% more. It's a hint that at least consumers are ready to do their part to get the economy going again.
Retail Sales Charts
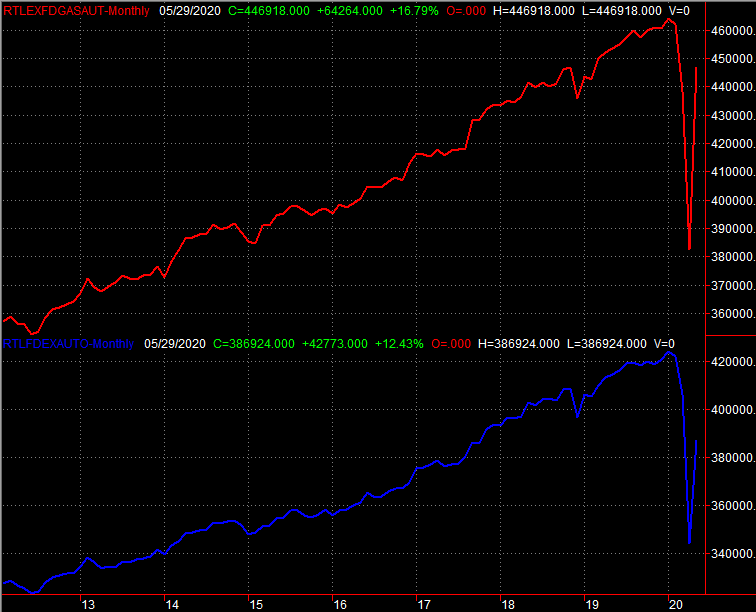
Source: Census Bureau, TradeStation
Finally, last week's remaining big news was starts and permits for May. They were... ok. Starts ticked a bit higher, to an annualized pace of 974,000, missing estimates by quite a bit. Permits rolled in at 1.22 million, also missing estimates, but not by much. Permits also grew by a fair amount. It's a mixed message, but one with a glimmer of hope.
Building Permits and Housing Charts

Source: Census Bureau, TradeStation
Everything else is on the grid.
Economic Calendar
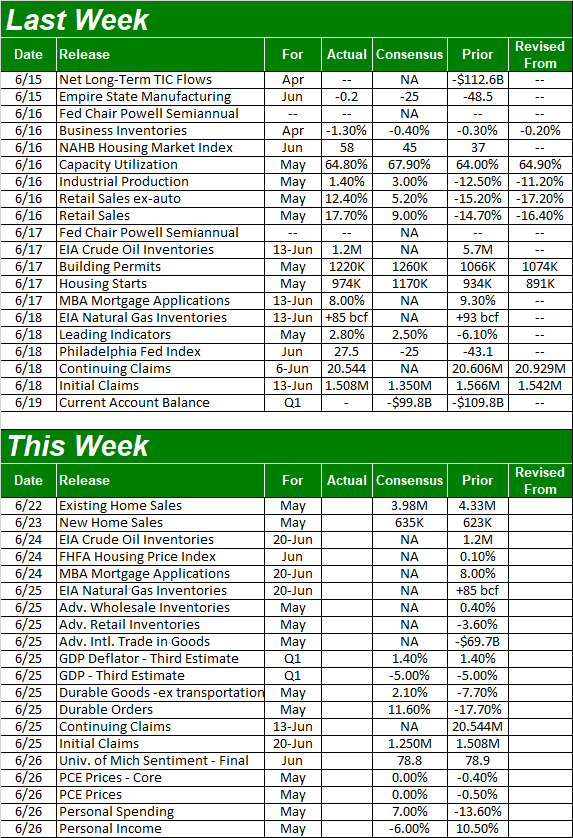
Source: Briefing.com
This week is pretty full, but little of what's in store is all that important. We'll start the week with new and existing home sales numbers to round out the real estate picture, but don't look for much progress. Sales of existing homes are projected to slump a little, while new home sales should tick just a tad higher. Nobody really knows, however, and just keep in mind that holding steady is a victory of sorts.
New Home Sales Charts
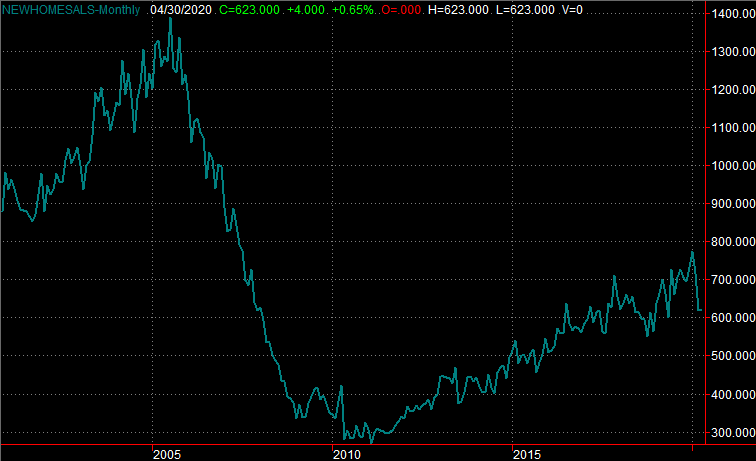
Source: Census Bureau, TradeStation
On Thursday we'll get the third look at last quarter's GDP growth rate, though don't look for any change - it's still apt to have slumped by 5% thanks to coronavirus shutdowns. (It's apt to be even worse for Q2.) Then on Friday we'll get the last word on the University of Michigan Sentiment Index for the month. It looks like it's going to hold steady right around 78.8, indicating people are at least getting past the initial shock of COVID-19.
Consumer Sentiment Charts
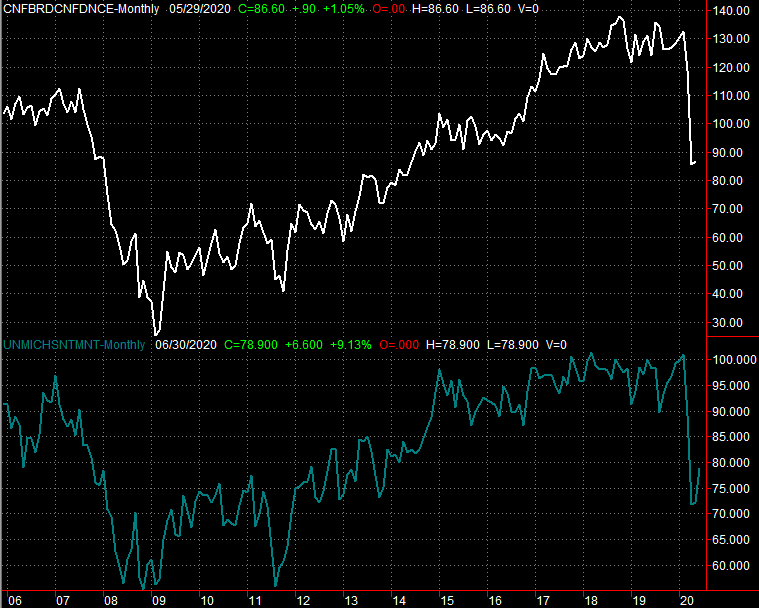
Source: Univ. of Michigan, Conference Board, TradeStation
Stock Market Index Analysis
First and foremost, don't freak out over the volume behind Friday's modest move lower. It was a so-called triple-witching day, where monthly and quarterly options and futures expire. That can force traders to take action they may not have otherwise taken. It's not necessarily a sign that a slew of sellers are suddenly coming out of the woodwork.
Instead, focus on the fact that when push came to shove, the S&P 500 managed to hold above the 20-day moving average line (blue). It was an ugly effort, though it was a successful effort. You'll also see a support line that goes back to the early April low is in play now (orange, dashed). That line is in the midst of all the key moving average lines, bolstering their collective support. Take note of the fact that the 50-day moving average line (purple) Is nearing a cross back above the 200-day moving average line (green)... a "golden cross" that supposedly points to more bullishness ahead.
S&P 500 Daily Chart, with VIX and Volume
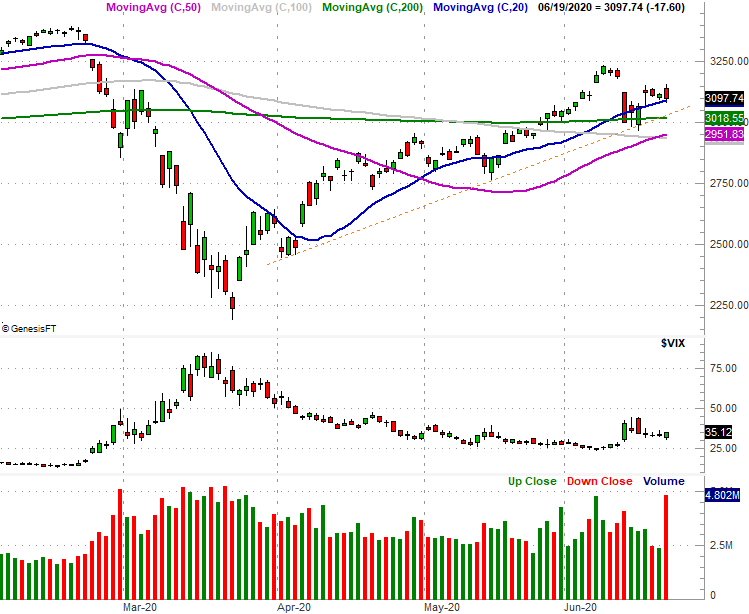
Source: TradeNavigator
The NASDAQ is faring much better than the S&P 500 is, moving to within reach of the record high hit earlier this month with a gain on Friday; it doesn't even need to push off of the support made by any of its moving average lines.
NASDAQ Composite Daily Chart, with Up and Down Volume

Source: TradeNavigator
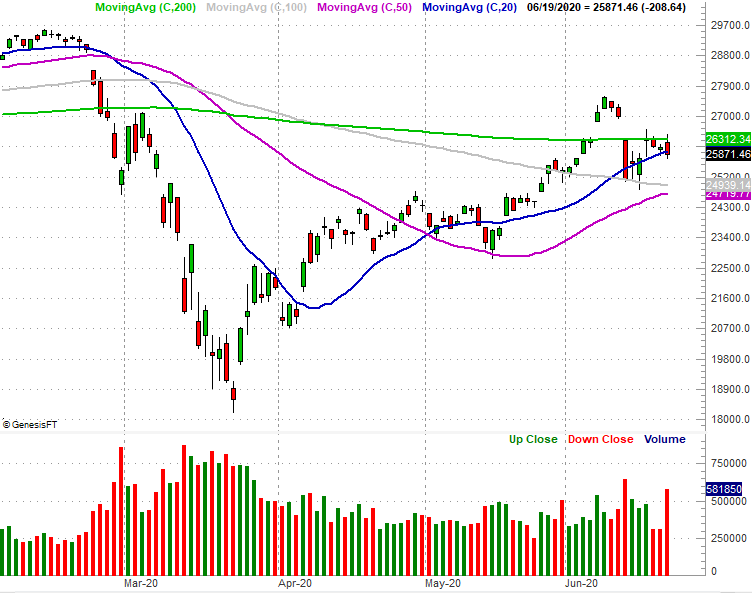
Interestingly, not only is the Dow Jones Industrial Average not doing as well as the NASDAQ Composite or even the S&P 500, it's downright having problems. It broke above its 200-day moving average line (green) a couple of weeks ago, tumbled back under it a couple ofay days later, and try as it might, it just couldn't push its way back above it again last week. It is finding support at the 100-day moving average line (gray), but this isn't quite what the bulls were hoping for.
Dow Jones Industrial Average Daily Chart, with Volume
Source: TradeNavigator
There's a method to this madness, so to speak. It's a not-entirely-subtle clue that traders are favoring aggressive tech names and aren't quite as stoked about the better-established blue chips the Dow Jones Industrial Average tends to represent. That's not a bad thing though. While a little more balance would be nice, the fact that traders are seeking risk rather than seeking safety suggests they have a mindset that will keep the advance going.
On the other hand, with earnings season coming up, those optimists may be in fir a rude awakening. As bad as COVID-19 was for Q1's numbers, they're expected to be much, much worse for Q2's bottom lines. Standard & Poor's predicts the S&P 500's Q2 income will be down 42% year-over-year. Energy, discretionary, and industrials should be hit particularly hard. Tech, impressively, should see fairly stable bottom lines. Traders should still be on the lookout for a setback among the names they've been buying up in earnest though, as they make for the biggest profit-taking targets.
But, first things first. This week's priority is simply watching to see how - or if - the aforementioned moving average lines push, pull, contain, or support the indices. The Dow is especially in trouble, stuck under its 200-day moving average line at 26,312. The S&P 500 is holding up at its 20-day line at 3,097, though it could temporarily slide back to the 200-day moving average line at 3,018 and still not be too far gone to recover.